. 2009 Sep;7(9):e1000201.
doi: 10.1371/journal.pbio.1000201. Epub 2009 Sep 22.

In silico reconstitution of actin-based symmetry breaking and motility

Affiliations

In silico reconstitution of actin-based symmetry breaking and motility

Mark J Dayel et al. PLoS Biol. 2009 Sep.

Abstract

Eukaryotic cells assemble viscoelastic networks of crosslinked actin filaments to control their shape, mechanical properties, and motility. One important class of actin network is nucleated by the Arp2/3 complex and drives both membrane protrusion at the leading edge of motile cells and intracellular motility of pathogens such as Listeria monocytogenes. These networks can be reconstituted in vitro from purified components to drive the motility of spherical micron-sized beads. An Elastic Gel model has been successful in explaining how these networks break symmetry, but how they produce directed motile force has been less clear. We have combined numerical simulations with in vitro experiments to reconstitute the behavior of these motile actin networks in silico using an Accumulative Particle-Spring (APS) model that builds on the Elastic Gel model, and demonstrates simple intuitive mechanisms for both symmetry breaking and sustained motility. The APS model explains observed transitions between smooth and pulsatile motion as well as subtle variations in network architecture caused by differences in geometry and conditions. Our findings also explain sideways symmetry breaking and motility of elongated beads, and show that elastic recoil, though important for symmetry breaking and pulsatile motion, is not necessary for smooth directional motility. The APS model demonstrates how a small number of viscoelastic network parameters and construction rules suffice to recapture the complex behavior of motile actin networks. The fact that the model not only mirrors our in vitro observations, but also makes novel predictions that we confirm by experiment, suggests that the model captures much of the essence of actin-based motility in this system.


Conflict of interest statement

The authors have declared that no competing interests exist.

Figures

Figure 1
Figure 1. Simulations qualitatively mimic in vitro symmetry breaking and bead motility.
(A–D) Time series of in vitro symmetry breaking and motility for beads uniformly coated with ActA (see Video S1). (E–H) Time series of a computer simulation of symmetry breaking and motility (2-D projections convolved with Gaussian, projection plane chosen parallel to shell opening; see Video S2). (I–L) 3-D view of simulation showing links colored by tensile stress (see Video S3; color bar range represents zero [blue] to breakage stress [red]). A–D correspond to 70s, 106s, 175s and 344s. E–H and I–J correspond to frames 70, 134, 185 and 330 of the simulation (see Figure 3 for detailed kinetics).
Figure 2
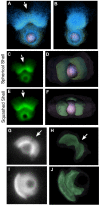
Figure 2. The 3-D geometry of symmetry breaking.
(A and B) Top and side views of simulated network shortly after symmetry breaking showing that symmetry breaking is in one axis only. (C) 2-D projection of unconstrained simulation after symmetry breaking shows dent in the center of the shell. (D) 3-D isosurface representation of network and bead during symmetry breaking shows linear crack. (E and F) Same as (C and D), but network is constrained in z-direction between two parallel planes to mimic experimental conditions (note lesser dent in shell). (G–J) Projections and 3-D reconstructions of experimental data after symmetry breaking. (G and H) show a 5-µm bead with 15.5-µm spacers, (I and J) a 5-µm bead with 5.1-µm spacers. Arrows in (A–H) indicate rip in outer shell. See Figures S4, S5, and S6 for interactive 3D views.
Figure 3
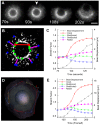
Figure 3. Shell deformations during symmetry breaking in vitro and in silico.
(A) Fluorescent speckle microscopy (FSM) of in vitro symmetry breaking, time points as indicated (see Video S5). Arrowhead indicates initial rip in shell. (B) Diagram showing how geometric parameters are extracted from FSM data. Lengths between point pairs are plotted in (C). (C) Geometric parameters of in vitro symmetry breaking show outer circumferential contraction and radial expansion. Colors correspond to (B). Initial lengths prior to symmetry breaking are normalized to one. (D) Diagram showing how measurements are extracted from simulation (see Video S6) (for clarity, only outer circumferential measures shown). Points that span the crack are not included in circumferential measures; other measures are similar and correspond to those in (C). (E) Geometric parameters of in silico symmetry breaking show outer circumferential contraction and radial expansion similar to (C). Initial lengths prior to symmetry breaking are normalized to one.
Figure 4
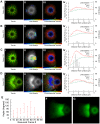
Figure 4. The mechanism of symmetry breaking.
(A–D) Strain buildup and release by link breakage (see Video S8). Four time points showing (i) node tracks, (ii) link breaks, (iii) circumferential tension, and (iv) graphs showing how circumferential tension, radial tension, and link breaks vary with distance from the surface of the bead. For link breaks in (ii), color scale bar represents increasing density to the right (red). For circumferential tension in (iii), scale bar represents increasing tension to the right (red) with the black notch representing zero, and the left representing negative tension (i.e., compression) in blue. In (iv) forces are summed and split into radial and circumferential components. (E) Symmetry-breaking direction is determined late. One simulation was repeated, restarting at frames shown, and the angle of the new symmetry-breaking direction calculated relative to the original direction (mean±standard deviation, n = 5). The directions are essentially random until frame 80, after which they become the same as the original run, showing that the direction is determined between frames 70 and 80. This corresponds to a shell similar to the time point shown in (B). (F) Decreasing the network spring constant increases the thickness of the shell (F L = 1.5 pN). (G) Increasing the threshold for link breakage produces a flat shell (F BL = 5.5 pN). (Units are nominal—see text.)
Figure 5
Figure 5. The mechanism of smooth motility.
(A) Orthogonal 2-D views of in silico network trajectory, with network marked red at even intervals of time and position around the bead. Nodes in the 3-D network are convolved with a Gaussian and projected in x or y directions as shown. (B) Orthogonal 3-D views of the network trajectory show linear ripping at front and no orthogonal squeezing. Lines represent trajectories relative to the bead for an evenly distributed subset of nodes. (C) In vitro network tracks during smooth motility showing no orthogonal squeezing. Image is a composite of sequential fluorescent speckle microscopy images (see Video S13) colored by time and registered to the bead. (D) Distribution of circumferential tension (red) and compression (blue) around in silico bead during smooth motility. Circumferential tension is localized to the outer network and front of bead. (E and F) Diagram of how circumferential and radial measurements for smooth motion were taken. Measurements exclude points in front of the bead where the rip occurs (see Videos S14 and S15). (G–L) Network stretching and bead velocity for 3 regimes of smooth motility: (G and H) elastic network (default parameters), (I and J) less elastic network (R M = 5.0 pN, F BL = 2.0 pN, and F L = 4.0 pN), and (K and L) less elastic network with network locked in place before circumferential contraction occurs. (M and N) Orthogonal views and of symmetry breaking and motility from (I and J; see Videos S16 and S17). (Units are nominal—see text.)
Figure 6
Figure 6. Increasing the degree of network crosslinking (P XL) causes a transition from smooth to pulsatile motion.
(A) Network morphologies and (B) bead velocities over time for values of P XL indicated. Very low crosslinking (P XL = 0.125) leads to no symmetry breaking. Low crosslinking (P XL = 0.375) bead oozes from network cloud. Higher crosslinking (P XL = 0.625) gives normal shell symmetry break and smooth motion, and very high crosslinking(P XL = 0.875) leads to repeated shell formation and pulsatile motion as the shells break.
Figure 7
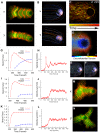
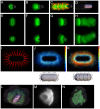
Figure 7. Simulation predicts sideways symmetry breaking and motility for symmetrically coated Listeria and ellipsoids.
(A–D) Simulation with nucleation localized to only one half shows motion in the direction of the long axis of the Listeria. (A–C) Time series during motion. (C) also shows regularly spaced and timed speckle tracks that show trajectory and deformations of the network (see Video S19). (D) 3-D network trajectory showing no orthogonal squeezing (see Figure S8). (E–H) Time series of simulation for uniformly nucleating Listeria shows sideways symmetry breaking and motility (see Video S20) (side and top view of same run shown). (I) Network trajectory prior to symmetry breaking shows network being drawn towards poles of the capsule. (J and K) Circumferential link forces around the capsule split into components as shown (plotted to the same scale). Circumferential tension builds up preferentially around the long axis. (L) 3-D view of ellipsoid simulation after symmetry breaking showing sideways motion (see Video S21). Network density shown by isosurfaces: high density (green) and low density (semitransparent). (M) 2-D projection and (N) 3-D reconstruction of an in vitro ellipsoid experiment after symmetry breaking showing sideways symmetry break.
Figure 8
Figure 8. Model for symmetry breaking and motility.
(A) 3-D Mechanics of symmetry breaking. (i) The network grows symmetrically until (ii) circumferential tension tears the load-bearing inner network, and a linear crack forms in the shell. The crack propagates through the shell in a straight line at the points of high curvature (arrows). (iii) The crack propagates towards the rear of the shell (arrows), creating a weak point opposite the direction of motion, which acts as a hinge. (iv) The two lobes of the shell open in a plane (curved arrows) about this hinge, allowing the bead to escape. (B) Forces and site selection during symmetry breaking. (i) A loose network polymerizes at the surface of the bead and is pushed radially outward. (ii) Radial expansion causes the outer network to expand and creates circumferential tension, causing random small rips around the outer shell (marked by ×'s). This circumferential tension also compresses the inner network, increasing its density and creating a more rigid, brittle inner shell. Within this inner shell, a spherical shell (slightly away from the bead surface, shown in red) carries most of the circumferential tension. (iii) Circumferential tension is well balanced around this inner shell and continues to build until a small stochastic break occurs, whereupon positive feedback causes catastrophic failure (concentration of rips marked by ×'s) and the linear crack described in (A). (iv) The shell opens, with the outer network (“O”) contracting, the dense inner network (“I”) changing curvature but neither expanding or contracting, and the shell expanding in the radial direction (“R”). (C) Sustained rip model for smooth motility. (i) After symmetry breaking, new network (shown in blue) polymerizes at the surface of the bead. Contact with the original shell reinforces the network at the back, leaving a thinner weaker area of network at the front (“W”). As the new network expands radially, it creates circumferential tension, which rips through the weaker area at the front, and the bead moves forwards. (ii) The existing network at the back continues to reinforce new network (blue), maintaining the weak area (“W”) at the front of the bead. This weak area is sufficiently weak that ripping occurs before enough circumferential tension builds up to reinforce the shell and create a rigid inner region (compare with [B](ii) above) so the network deforms with plastic flow (arrows). (iii) This continues, with the tail rather than the original shell maintaining the rear reinforcement, and the bead moving at steady state (constant velocity) through a sustained rip at the front of the bead.

Comment in

  • Blasting off on an actin comet tail.
    Sedwick C. Sedwick C. PLoS Biol. 2009 Sep 22;7(9):e1000195. doi: 10.1371/journal.pbio.1000195. PLoS Biol. 2009. PMID: 20076753 Free PMC article. No abstract available.

Similar articles

Cited by

References

    1. Pollard T. D, Earnshaw W. C, Lippincott-Schwartz J. Cell biology. Philadelphia, PA: Saunders/Elsevier; 2008. 905
    1. Chhabra E. S, Higgs H. N. The many faces of actin: matching assembly factors with cellular structures. Nat Cell Biol. 2007;9:1110–1121. - PubMed
    1. Mullins R. D, Heuser J. A, Pollard T. D. The interaction of Arp2/3 complex with actin: nucleation, high affinity pointed end capping, and formation of branching networks of filaments. Proc Natl Acad Sci U S A. 1998;95:6181–6186. - PMC - PubMed
    1. Svitkina T. M, Borisy G. G. Arp2/3 complex and actin depolymerizing factor/cofilin in dendritic organization and treadmilling of actin filament array in lamellipodia. J Cell Biol. 1999;145:1009–1026. - PMC - PubMed
    1. Nakamura F, Osborn E, Janmey P. A, Stossel T. P. Comparison of filamin A-induced cross-linking and Arp2/3 complex-mediated branching on the mechanics of actin filaments. J Biol Chem. 2002;277:9148–9154. - PubMed

Publication types