. 2009 Dec;83(23):12185-95.
doi: 10.1128/JVI.01667-09. Epub 2009 Sep 16.

Multifaceted sequence-dependent and -independent roles for reovirus FAST protein cytoplasmic tails in fusion pore formation and syncytiogenesis

Affiliations

Multifaceted sequence-dependent and -independent roles for reovirus FAST protein cytoplasmic tails in fusion pore formation and syncytiogenesis

Christopher Barry et al. J Virol. 2009 Dec.

Abstract

Fusogenic reoviruses utilize the FAST proteins, a novel family of nonstructural viral membrane fusion proteins, to induce cell-cell fusion and syncytium formation. Unlike the paradigmatic enveloped virus fusion proteins, the FAST proteins position the majority of their mass within and internal to the membrane in which they reside, resulting in extended C-terminal cytoplasmic tails (CTs). Using tail truncations, we demonstrate that the last 8 residues of the 36-residue CT of the avian reovirus p10 FAST protein and the last 20 residues of the 68-residue CT of the reptilian reovirus p14 FAST protein enhance, but are not required for, pore expansion and syncytium formation. Further truncations indicate that the membrane-distal 12 residues of the p10 and 47 residues of the p14 CTs are essential for pore formation and that a residual tail of 21 to 24 residues that includes a conserved, membrane-proximal polybasic region present in all FAST proteins is insufficient to maintain FAST protein fusion activity. Unexpectedly, a reextension of the tail-truncated, nonfusogenic p10 and p14 constructs with scrambled versions of the deleted sequences restored pore formation and syncytiogenesis, while reextensions with heterologous sequences partially restored pore formation but failed to rescue syncytiogenesis. The membrane-distal regions of the FAST protein CTs therefore exert multiple effects on the membrane fusion reaction, serving in both sequence-dependent and sequence-independent manners as positive effectors of pore formation, pore expansion, and syncytiogenesis.


Figures

FIG. 1.
FIG. 1.
ARV p10 and RRV p14 FAST protein topologies and tail truncations. (A) Diagrammatic representation of the p10 and p14 FAST proteins showing their topology in the plasma membrane. Both are single-pass transmembrane proteins with N-terminal ectodomains on the surface of cells and C-terminal endodomains in the cytoplasm. Structural motifs include hydrophobic patches (HP), polybasic motifs (PB), fatty acid modifications (indicated by squiggly lines) that are either the N-terminal myristoylation or palmitoylation of a dicysteine motif (CC), and a polyproline motif (PP). The total number of residues in each protein is indicated by the numbers. (B) The amino acid sequences of the p10 and p14 endodomains are shown, along with the motifs described above. Progressive truncations of the CTs were constructed (arrows), with the numbers indicating the last amino acid present in the full-length proteins or each truncation.
FIG. 2.
FIG. 2.
C-terminal truncations progressively reduce, and eventually eliminate, fusion activity. (A) QM5 cells were transfected with the indicated constructs (p14, p14c105, p14c78, p10, p10c90, or p10c86) and Giemsa stained at either 8 h or 26 h posttransfection for the p14 and p10 constructs, respectively. Syncytial nuclei present in five random microscopic fields were quantified, and results are presented as the mean numbers of syncytial nuclei per field ± SD from one of two experiments conducted in triplicate. (B) The same experiment described above (A) except that cells were Giemsa stained, and images were captured by bright-field microscopy at a ×200 magnification at different time points (p14, 8 h; p14c105, 10 h; p14c78, 24 h; p10, 20 h; p10c90, 38 h; p10c86, 48 h) to show the progression of syncytium formation.
FIG. 3.
FIG. 3.
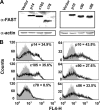
C-terminal truncations have variable effects on expression of FAST proteins. (A) QM5 cells were transfected with the indicated FAST protein constructs or with empty vector, and cell lysates were harvested at either 8 h or 26 h posttransfection for the p14 and p10 constructs, respectively. Lysates were analyzed by Western blotting using antisera specific for p10 or p14 or using anti-actin antibody as a loading control. (B) Expression of the various FAST protein constructs in the plasma membrane was quantified by labeling intact transfected cells with anti-p14 ectodomain or anti-p10 full-length antibodies at 24 h posttransfection, as described in Materials and Methods, followed by goat anti-rabbit Alexa 647-conjugated secondary antibody. Labeled cells were analyzed by flow cytometry, and results are presented as relative fluorescence (FL4-H) versus cell counts. Shaded gray histograms indicate background fluorescence from empty vector-transfected cells, while the gray and black line tracings indicate duplicate samples of cells transfected with the indicated FAST protein constructs from a single representative experiment.
FIG. 4.
FIG. 4.
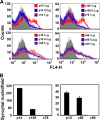
C-terminal truncations reduce fusion activity independent of cell surface expression levels. (A) QM5 cells were transfected with the indicated amounts of plasmid DNA expressing the p10 or p14 constructs, and nonpermeabilized cells were analyzed for cell surface fluorescence by flow cytometry using antisera specific for p10 or p14, as described in Materials and Methods. Gray histograms are the fluorescence profiles of cells transfected with empty vector and stained with the same antisera. (B) Cells were transfected with quantities of plasmid DNA that yielded equivalent levels of surface expression of the p10 or p14 constructs, and syncytial nuclei were quantified at 8 h or 24 h posttransfection for the p14 and p10 mutants, respectively, as described in the legend of Fig. 2. Results are presented as the mean numbers of syncytial nuclei per microscopic field ± SD from one of two experiments conducted in triplicate.
FIG. 5.
FIG. 5.
The membrane-distal region of the p14 CT drives fusion pore formation. (A) QM5 cells cotransfected with pEGFP and the indicated p14 constructs were cocultured with Vero target cells labeled with calcein red-orange. Cells were resuspended, fixed 9 h posttransfection, and analyzed by flow cytometry. The GFP-positive transfected cells were gated, and the percentages of GFP-positive cells that acquired the aqueous calcein red fluor due to pore formation (indicated above the horizontal threshold line) were quantified and are shown relative to the forward scatter (FSC-H). (B) A similar experiment was performed as described above (A), and results are presented as the calcein red fluorescence distribution of the gated GFP-positive cells (black line tracing). The percentage of cells with calcein red fluorescence above the background fluorescence profile of empty-vector-transfected cells (filled gray histogram) was determined by Overton subtraction of the fluorescence profiles of the two cell populations and is indicated. (C) The dot plots in A and Overton subtraction analysis of the fluorescence profiles in B were quantified and are presented as the means ± SD from one of three experiments conducted in triplicate.
FIG. 6.
FIG. 6.
The membrane-distal region of the p10 CT drives fusion pore formation. QM5 cells cotransfected with pEGFP and the indicated p14 constructs were cocultured with Vero target cells labeled with calcein red-orange. Cells were resuspended and fixed 26 h posttransfection, and the percentages of GFP-positive cells that acquired the aqueous calcein red fluor due to pore formation were quantified from the dot plots as described in the legend of Fig. 5. Results are presented as the means ± SD from one of three experiments conducted in triplicate.
FIG. 7.
FIG. 7.
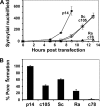
Reextending the C terminus of p14 with scrambled sequences, but not random sequences, restores pore formation and syncytiogenesis. (A) The nonfusogenic p14c78 truncation was reextended to full length with either a scrambled version of the deleted amino acids (Sc) or the same number of random amino acids (Ra). These constructs, along with p14, p14c105, and p14c78, were transfected into QM5 cells using amounts of DNA to give equalized surface expression levels. Transfected cells were fixed and Giemsa stained at the indicated times posttransfection, and a syncytial index based on the numbers of syncytial nuclei/microscopic field was determined. Results are the means ± SD from one of three experiments conducted in triplicate. (B) QM5 cells were cotransfected with pEGFP and the indicated p14 constructs at plasmid doses that yielded equivalent cell surface expression levels, and transfected cells were cocultured with Vero target cells labeled with calcein red-orange. Cells were resuspended and fixed 7 h posttransfection, and the percent pore formation was determined by flow cytometry and Overton subtraction as described in the legend of Fig. 5. Results are the means ± SD from one of two experiments conducted in triplicate.
FIG. 8.
FIG. 8.
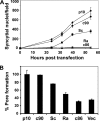
Scrambled, but not random, amino acids at the C terminus of p10 support pore formation and syncytiogenesis. (A) The nonfusogenic p10c86 truncation was reextended to full length with either a scrambled version of the deleted amino acids (Sc) or the same number of random amino acids (Ra). These constructs, along with p10, p10c90, and p10c86, were transfected into QM5 cells using amounts of DNA to give equalized surface expression levels. Transfected cells were fixed and Giemsa stained at the indicated times posttransfection, and a syncytial index based on the numbers of syncytial nuclei/microscopic field was determined. Results are the means ± SD from one of three experiments conducted in triplicate. (B) QM5 cells were cotransfected with pEGFP and the indicated p10 constructs at plasmid doses that yielded equivalent cell surface expression levels, and transfected cells were cocultured with Vero target cells labeled with calcein red-orange. Cells were resuspended and fixed 27 h posttransfection, and the percent pore formation was determined by flow cytometry and threshold analysis of the dot plots as described in the legend of Fig. 5. Results are the means ± SD from one of two experiments conducted in triplicate.

Similar articles

Cited by

References

    1. Abrahamyan, L. G., S. R. Mkrtchyan, J. Binley, M. Lu, G. B. Melikyan, and F. S. Cohen. 2005. The cytoplasmic tail slows the folding of human immunodeficiency virus type 1 Env from a late prebundle configuration into the six-helix bundle. J. Virol. 79:106-115. - PMC - PubMed
    1. Aguilar, H. C., W. F. Anderson, and P. M. Cannon. 2003. Cytoplasmic tail of Moloney murine leukemia virus envelope protein influences the conformation of the extracellular domain: implications for mechanism of action of the R peptide. J. Virol. 77:1281-1291. - PMC - PubMed
    1. Aguilar, H. C., K. A. Matreyek, D. Y. Choi, C. M. Filone, S. Young, and B. Lee. 2007. Polybasic KKR motif in the cytoplasmic tail of Nipah virus fusion protein modulates membrane fusion by inside-out signaling. J. Virol. 81:4520-4532. - PMC - PubMed
    1. Bagai, S., and R. A. Lamb. 1996. Truncation of the COOH-terminal region of the paramyxovirus SV5 fusion protein leads to hemifusion but not complete fusion. J. Cell Biol. 135:73-84. - PMC - PubMed
    1. Broer, R., B. Boson, W. Spaan, F. L. Cosset, and J. Corver. 2006. Important role for the transmembrane domain of severe acute respiratory syndrome coronavirus spike protein during entry. J. Virol. 80:1302-1310. - PMC - PubMed

Publication types

Substances