. 2009 Sep 11:10:427.
doi: 10.1186/1471-2164-10-427.

Genome-wide expression profiling of in vivo-derived bloodstream parasite stages and dynamic analysis of mRNA alterations during synchronous differentiation in Trypanosoma brucei

Affiliations

Genome-wide expression profiling of in vivo-derived bloodstream parasite stages and dynamic analysis of mRNA alterations during synchronous differentiation in Trypanosoma brucei

Sarah Kabani et al. BMC Genomics. .

Abstract

Background: Trypanosomes undergo extensive developmental changes during their complex life cycle. Crucial among these is the transition between slender and stumpy bloodstream forms and, thereafter, the differentiation from stumpy to tsetse-midgut procyclic forms. These developmental events are highly regulated, temporally reproducible and accompanied by expression changes mediated almost exclusively at the post-transcriptional level.

Results: In this study we have examined, by whole-genome microarray analysis, the mRNA abundance of genes in slender and stumpy forms of T.brucei AnTat1.1 cells, and also during their synchronous differentiation to procyclic forms. In total, five biological replicates representing the differentiation of matched parasite populations derived from five individual mouse infections were assayed, with RNAs being derived at key biological time points during the time course of their synchronous differentiation to procyclic forms. Importantly, the biological context of these mRNA profiles was established by assaying the coincident cellular events in each population (surface antigen exchange, morphological restructuring, cell cycle re-entry), thereby linking the observed gene expression changes to the well-established framework of trypanosome differentiation.

Conclusion: Using stringent statistical analysis and validation of the derived profiles against experimentally-predicted gene expression and phenotypic changes, we have established the profile of regulated gene expression during these important life-cycle transitions. The highly synchronous nature of differentiation between stumpy and procyclic forms also means that these studies of mRNA profiles are directly relevant to the changes in mRNA abundance within individual cells during this well-characterised developmental transition.


Figures

Figure 1
Figure 1
Schema for the study. A. Schematic diagram of the transitions studied in this investigation. To derive pleomorphic slender (SL) samples, parasitaemias were harvested 3 days post infection. For pleomorphic stumpy (ST) samples, infections were harvested 6 days post infection. From stumpy-enriched samples, differentiation time courses were established, with the major events of this process being annotated, along with their approximate timings. PC= procyclin, VSG = variant surface glycoprotein. B. Sample isolations from the experiments carried out in this study. Four bio-replicates of pleomorphic slender forms were derived, SL1, SL2 SL3, SL4. Five independent stumpy form samples were also generated from individual mouse infections (a, b, c, d, e) these being used to initiate five differentiation time courses. RNA samples generated from each bio-replicate are shown, these being those labelled and used for microarray hybridizations.
Figure 2
Figure 2
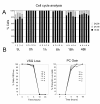
Cell cycle and surface antigen analysis during differentiation. A. Analysis of the percentage of cells in different cell-cycle phases (1 kinetoplast, 1 nucleus, Black; 2 kinetoplasts, 1 nucleus, grey; 2 kinetoplasts, 2 nuclei, white) from each of the bio-replicates and time points considered in this analysis. Most notably, the stumpy population is uniformly arrested in G1/G0 and cells progressing back into a proliferative cell-cycle begin to appear between 6-18 h after the initiation of differentiation. B. Expression of the bloodstream-stage specific variant surface glycoprotein (VSG) coat and EP procyclin (PC) coat on each of the bio-replicates and time points evaluated in this analysis. Samples were scored by immuofluorescence staining for the expression of each antigen. EP procyclin was weakly detectable at 1 h, but strongly expressed within 6 h.
Figure 3
Figure 3
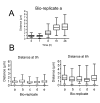
Kinetoplast repositioning during differentiation. A. Repositioning of the kinetoplast for cells undergoing differentiation from stumpy forms. Values represent the distance from the kinetoplast to the cell posterior measured for 100 cells at each time point and are derived from bio-replicate a. B. Repositioning of the kinetoplast for all bio-replicates, measured at 0 h and 6 h after the initiation of differentiation. Measures represent the distance between the kinetoplast and cell posterior for 100 cells at each time point and for each bioreplicate.
Figure 4
Figure 4
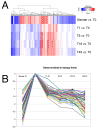
Expression profiles of genes at different time points in the analysis. A. Heatmap of expression differences of all samples relative to stumpy samples (T = 0). The genes included were significant at the p < 0.001 level in one or more contrasts. The logFC values have been heatmapped, with blue representing down-regulation and red representing up-regulation. Genes are along the x-axis and comparisons are represented along the y-axis, with gene profiles being clustered by Euclidian distance, their relatedness being shown in the dendogram above the heatmap. B. Expression profile of genes identified as being enriched in stumpy forms. The genes shown are those identified in the trinary groups (-1,-1,-1,-1,-1) and (0,-1,-1,-1,-1). The y axis represents the LC fold change, the X-axis is the time point during the differentiation programme.
Figure 5
Figure 5
Validation of the microarray by alternative expression assays. A. qRT-PCR analysis of the expression profile of six test transcripts identified as being enriched in stumpy forms by microarray hybridization. The relative expression is shown (y-axis) at each time point (x-axis), the expression ratio being normalised to a control transcript (Tb10.389.0540). B. Northern blot showing the relative expression of trypanosome alternative oxidase (Tb10.6k15.3640) in samples from one time course assay, using the same mRNAs used for microarray hybridization. The relative loading is indicated by the rRNA beneath the blot, this being revealed by ethidium bromide staining.
Figure 6
Figure 6
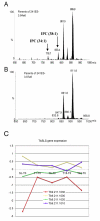
IPC expression in different life cycle stages. Lipids extracted from stumpy (Panel A) and monomorphic slender (Panel B) T.brucei, were analyzed by ES-MS/MS for GPIno phospholipids by parent-ion scanning of the m/z 241 as described in experimental procedures. Peak assignments are based on MS/MS daughter ion spectra and comparisons to previous experiments on whole cell extracts. Panel C shows the relative expression of each member of the TbSLS gene family (TbSLS1, Tb9.211.1030; TbSLS2, Tb9.211.1020; TbSLS3, Tb9.211.1010; TbSLS4, Tb9.211.1000) during the differentiation between slender and stumpy forms and at each point during differentiation from stumpy to procyclic forms. TbSLS1 is significantly up-regulated during these transitions.
Figure 7
Figure 7
Expression changes for a subset of genes whose developmental expression profile is known. A. Relative expression of various transcripts known to be regulated between bloodstream monomorphic forms and procyclic forms. The expression of each transcript is represented such that they are expressed relative to their level in pleomorphic slender forms (this being normalised to zero). Hence, each transcript begins with a 'zero-value' column, representing the slender vs. slender comparison. ESAG 2, ESAG11 and the glucose transporter HXT (THT1) are bloodstream enriched, whereas the transcripts encoding EP2, EP3-3 and GPEET procyclin, PSSA2 and a molecule related to the Leishmania metacyclic-promoastigote Meta 1 protein are procyclic enriched. Cell cycle regulated transcripts; histone H2a and histone H4 are induced around 6 h after the initiation of differentiation, coincident with preparation of the cells for cell-cycle re-entry (Figure 2A). B. Relative expression of proteins associated with metabolic development of parasites as they differentiate to procyclic forms. Seven nuclear encoded components of the cytochrome oxidase complex have been previously characterized with respect to their developmental expression and control. Also shown is the relative expression of PGK A, PGK B and PGK C which are differentially regulated in the trypanosome life cycle. All transcripts show the expected expression profiles. Values are expressed relative to the expression of each transcript in pleomorphic slender forms.
Figure 8
Figure 8
Dynamic expression profile changes during differentiation between stumpy and procyclic forms. The expression profile of each transcript cohort is shown on the left hand side and represents the overall expression of transcripts relative to stumpy forms. Transcripts induced at different times during differentiation are shown on the top panel, whereas transcripts transiently elevated during development are shown on the bottom panel. The right hand side shows the number of genes in each cohort.
Figure 9
Figure 9
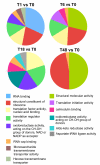
Gene ontology classifications for transcripts elevated at different time points after the initiation of differentiation from stumpy forms to procyclic forms. Up-regulated genes at each time point were classified according to the 'molecular function' gene ontology and the frequency of members of each classification plotted as a fraction of the total number of regulated genes. The source data for genes up- and down- regulated during differentiation and at transient windows throughout the differentiation programme are provided in Additional file 8.
Figure 10
Figure 10
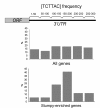
Motif analysis for the regulation of transcripts predicted to be up-regulated in stumpy forms. Oligonucleotide frequency analysis of the 300 nt downstream of genes identified as being up-regulated in stumpy forms with respect to other points in the differentiation programme. Two motifs were identified as being statistically overrepresented, of which SM1 (TCTTAC) was also elevated among the most strongly regulated genes in the stumpy expressed cohort. Positional analysis of the 3'UTR of those transcripts with this motif demonstrated a location bias 151-200 nt downstream of the stop codon of the associated gene. In contrast the position of the motif among genes not up-regulated in stumpy forms demonstrated no discernable positional bias.

Similar articles

Cited by

References

    1. Cho RJ, Campbell MJ, Winzeler EA, Steinmetz L, Conway A, Wodicka L, Wolfsberg TG, Gabrielian AE, Landsman D, Lockhart DJ, et al. A genome-wide transcriptional analysis of the mitotic cell cycle. Mol Cell. 1998;2:65–73. doi: 10.1016/S1097-2765(00)80114-8. - DOI - PubMed
    1. Chu S, DeRisi J, Eisen M, Mulholland J, Botstein D, Brown PO, Herskowitz I. The transcriptional program of sporulation in budding yeast. Science. 1998;282:699–705. doi: 10.1126/science.282.5389.699. - DOI - PubMed
    1. McCarroll SA, Murphy CT, Zou S, Pletcher SD, Chin CS, Jan YN, Kenyon C, Bargmann CI, Li H. Comparing genomic expression patterns across species identifies shared transcriptional profile in aging. Nat Genet. 2004;36:197–204. doi: 10.1038/ng1291. - DOI - PubMed
    1. White KP, Rifkin SA, Hurban P, Hogness DS. Microarray analysis of Drosophila development during metamorphosis. Science. 1999;286:2179–2184. doi: 10.1126/science.286.5447.2179. - DOI - PubMed
    1. Hall N, Karras M, Raine JD, Carlton JM, Kooij TW, Berriman M, Florens L, Janssen CS, Pain A, Christophides GK, et al. A comprehensive survey of the Plasmodium life cycle by genomic, transcriptomic, and proteomic analyses. Science. 2005;307:82–86. doi: 10.1126/science.1103717. - DOI - PubMed

Publication types