. 2009 Oct 30;284(44):30583-93.
doi: 10.1074/jbc.M109.010678. Epub 2009 Aug 31.

Egr-1 is necessary for fibroblast growth factor-2-induced transcriptional activation of the glial cell line-derived neurotrophic factor in murine astrocytes

Affiliations

Egr-1 is necessary for fibroblast growth factor-2-induced transcriptional activation of the glial cell line-derived neurotrophic factor in murine astrocytes

Soon Young Shin et al. J Biol Chem. .

Abstract

Glial cell line-derived neurotrophic factor (Gdnf) promotes neurite outgrowth and survival of neuronal cells, but its transcriptional regulation is poorly understood. Here, we sought to investigate the mechanism underlying fibroblast growth factor-2 (FGF2) induction of Gdnf expression in astrocytes. We found that FGF2 stimulation of rat astrocytes induced expression of Egr-1 at a high level. Sequence analysis of the rat Gdnf gene identified three overlapping Egr-1-binding sites between positions -185 and -163 of the rat Gdnf promoter. Transfection studies using a series of deleted Gdnf promoters revealed that these Egr-1-binding sites are required for maximal activation of the Gdnf promoter by FGF2. Chromatin immunoprecipitation analysis indicated that Egr-1 binds to the Gdnf promoter. Furthermore, the induction of Gdnf expression by FGF2 is strongly attenuated both in C6 glioma cells stably expressing Egr-1-specific small interfering RNA and in primary cultured astrocytes from the Egr-1 knock-out mouse. Additionally, we found that stimulation of the ERK and JNK pathways by FGF2 is functionally linked to Gdnf expression through the induction of Egr-1. These data demonstrate that FGF2-induced Gdnf expression is mediated by the induction of Egr-1 through activation of the ERK and JNK/Elk-1 signaling pathways.


Figures
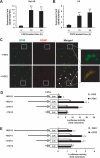
FIGURE 1.
FIGURE 1.
FGF2 activates transcription of Gdnf expression in rat astrocytes. A and B, primary cultured rat astrocytes (A) or C6 rat glioma cells (B) were treated with 0 or 10 ng/ml of FGF2 for 12 h. Total RNA was extracted and then subjected to RT-PCR to quantify Gdnf expression. Actin expression was used as an internal control. **, p < 0.01 compared with basal luciferase activity. C, immunodetection of Gdnf. Primary rat astrocytes cultured on coverslips were treated with 0 or 10 ng/ml of FGF2 for 18 h. After incubation with anti-Gdnf (1:100) and anti-S100 (1:200) antibodies, the cells were observed under a confocal fluorescence microscope; green, S-100; red, Gdnf. Arrows indicate immunoreactive cells for Gdnf. D and E, Gdnf promoter constructs (0.2 μg each) were transiently co-transfected with the pRL-null vector (50 ng) into primary rat astrocytes (D) or C6 glioma cells (E). At 24-h post-transfection, cells were treated with 0 or 10 ng/ml of FGF2 for 8 h, and luciferase activity was measured. The firefly luciferase activity was normalized to Renilla luciferase activity. The data represent the mean ± S.D. (error bars) of three independent experiments, each performed in triplicate. *, p < 0.05 compared with basal luciferase activity (Student's t test).
FIGURE 2.
FIGURE 2.
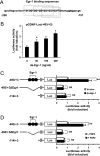
Functional role of Egr-1 and Egr-1-binding sequences in Gdnf promoter activation. A, sequence of the promoter region in the rat Gdnf gene (−185 to −163). The three putative Egr-1-binding sites are boxed, B, primary rat astrocytes were co-transfected with pGDNF-Luc(−493/+3) (0.2 μg), various concentrations of the DA-Egr-1 expression plasmid pCDNA3.1/Egr1(I293F), and the pRL-null vector (50 ng). At 24 h post-transfection, cells were collected, and luciferase activity was measured. *, p < 0.05 compared with basal luciferase activity (Student's t test). C, primary rat astrocytes were co-transfected with the DA-Egr-1 expression plasmid pCDNA3.1/Egr1(I293F) and 0.2 μg of a Gdnf promoter construct (pGDNF-Luc(−493/+3), pGDNF-Luc(−493/+3ΔEgr1), or pGDNF-Luc(−114/+3)). At 24 h post-transfection, cells were collected, and luciferase activity was measured. **, p < 0.01 compared with empty vector-transfected basal luciferase activity; ns, not significant (Student's t test). D, primary rat astrocytes were transfected as in C. At 24 h post-transfection, they were treated with 0 or 10 ng/ml of FGF2 for 8 h, and luciferase activity was measured. The firefly luciferase activity was normalized to the Renilla luciferase activity. The data shown represent the mean ± S.D. (error bars) of three independent experiments, each performed in triplicate. **, p < 0.01 compared with empty vector-transfected basal luciferase activity; ns, not significant (Student's t test).
FIGURE 3.
FIGURE 3.
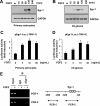
Induction of Egr-1 expression by FGF2. A and B, primary rat astrocytes (A) or C6 cells (B) were cultured in the presence of 0.5% serum for 24 h and then treated with 10 ng/ml of FGF2 for various lengths of time (15–240 min). The amount of Egr-1 in whole cell lysates was measured by Western blotting (15 μg of protein/lane) with rabbit anti-Egr-1 antibody. In the lower panel, the blot was re-probed with anti-GAPDH antibody as a loading control. C and D, primary rat astrocytes (C) or C6 cells (D) cells grown in 12-well plates were co-transfected with 0.5 μg of the Egr-1 promoter construct pEgr1-Luc(−780/+1) and 50 ng of pRL-null vector. Twenty-four hours after transfection, the cells were treated with varying concentrations of FGF2 (0–20 ng/ml) for 8 h. The firefly luciferase activity was normalized to the Renilla luciferase activity. The data shown represent the mean ± S.D. (error bars) of three independent experiments performed in triplicate. E, in ChIP experiments, rat primary astrocytes were treated with 0 or 10 ng/ml of FGF2 for 1 h, cross-linked, lysed, and immunoprecipitated with rabbit anti-Egr-1 antibody or with normal rabbit IgG (negative control). The precipitated DNA was subjected to PCR with primers specific to the Gdnf promoter. An aliquot of input DNA was used as a positive control. The schematic representation at the right shows the locations of the Egr-1-binding sites and PCR primers in the Gdnf promoter.
FIGURE 4.
FIGURE 4.
Role of ERK and JNK in FGF2-induced expression of Egr-1. A and B, primary rat astrocytes (A) and C6 cells (B) were cultured in the presence of 0.5% serum for 24 h and then treated with 10 ng/ml of FGF2 for various lengths of time. Total cell lysates were prepared, and Western blotting was performed using total protein extracts and antibodies against phospho-Raf1 (Ser259), phospho-(Thr180/Tyr182)-p38 kinase, phospho-(Thr183/Tyr185)-JNK1/2, phospho-(Thr202/Tyr204)-ERK1/2, and ERK2. Each blot is representative of at least three separate experiments. C and D, serum-starved primary rat astrocytes (C) and C6 cells (D) were treated with LY294002 (20 μm), U0126 (10 μm), SB203580 (20 μm), or SP600125 (20 μm) for 30 min and then treated with 0 or 10 ng/ml of FGF2 for 1 h. Total cell lysates were prepared and subjected to Western blotting with anti-Egr-1 antibody. The same blot was re-probed with anti-GAPDH antibody as an internal control. Each blot shown is representative of at least three separate experiments.
FIGURE 5.
FIGURE 5.
Role of ERK and JNK in FGF2 activation of the Gdnf promoter. Primary rat astrocytes were co-transfected with 50 ng of Elk-1 trans-activator plasmid (pFA2/Gal4-Elk-1), 50 ng of pRL-null vector, and 0.5 μg of the reporter plasmid pFR-Luc (A), the Egr-1 promoter-reporter plasmid pEgr1-Luc(−780/+1) (B), or the Gdnf promoter-reporter plasmid pGDNF Luc(−493/+3) (C), together with or without 0.2 μg of a plasmid expressing DN-MEK1 (pCGN1/MEK DN), DN-ERK2 (pHA-ERK2 K52R), or DN-JNK1 (pSRα/HA-JNK T183A/Y185F), as indicated. Twenty-four hours after transfection, the cells were treated with 0 or 10 ng/ml of FGF2 for 8 h. The resulting firefly luciferase activity was normalized to the Renilla luciferase activity. The data represent the mean ± S.D. (error bars) of three independent experiments performed in triplicate. *, p < 0.05; **, p < 0.01, compared with FGF2-treated control cells transfected with empty vector (Student's t test).
FIGURE 6.
FIGURE 6.
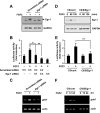
Effect of Egr-1 knockdown on FGF2-induced expression of Gdnf. A, primary rat astrocytes were transiently transfected with an shRNA plasmid expressing scrambled (pSilencer/scrambled) or Egr-1 (pSilencer/siEgr1) siRNA. After 48 h, cells were either untreated or treated with 10 ng/ml of FGF2 for 2 h, and the Egr-1 expression level was determined by Western blot analysis. The same blot was re-probed with anti-GAPDH antibody as a loading control. Each blot is representative of at least three separate experiments. B, primary rat astrocytes were transiently co-transfected with a Gdnf promoter-reporter plasmid (pGDNF-Luc(−493/+3)) and an shRNA plasmid expressing scrambled siRNA (pSilencer/scrambled) or Egr-1 siRNA (pSilencer/siEgr1), or with both shRNA plasmids, as indicated. After 48 h, cells were treated with 10 ng/ml of FGF2 for 8 h, and luciferase activity was measured. The firefly luciferase activity was normalized to the Renilla luciferase activity. The data represent the mean ± S.D. (error bars) of three independent experiments performed in triplicate. *, p < 0.05; **, p < 0.01 (Student's t test). C, primary rat astrocytes were transiently transfected with a scrambled siRNA (pSilencer/scrambled) or Egr-1 siRNA (pSilencer/siEgr1). After 48 h, cells were treated with 10 ng/ml of FGF2 for 12 h. Total RNA was extracted and assessed for Gdnf mRNA expression by RT-PCR. Similar results were obtained from three independent experiments. D, serum-starved C6 transfectants stably expressing scrambled siRNA (C6/cont) or Egr-1 siRNA (C6/siEgr1) were treated with 10 ng/ml of FGF2 for various lengths of time. At the indicated time points, the cells were collected and analyzed for Egr-1 expression using Western blotting. The same blot was re-probed with anti-GAPDH antibody as a loading control. Each blot shown is representative of at least three separate experiments. E, C6/cont and C6/siEgr1 cells were transiently transfected with a Gdnf promoter-reporter plasmid (pGDNF-Luc(−493/+3)). After 48 h, cells were treated with 10 ng/ml of FGF2 for 8 h, and luciferase activity was measured. The firefly luciferase activity was normalized to the Renilla luciferase activity. The data represent the mean ± S.D. (error bars) of three independent experiments performed in triplicate. **, p < 0.01 (Student's t test). F, C6/cont or C6/siEgr1 cells were treated with FGF2 for 12 or 24 h. Total RNA was extracted and assessed for Gdnf mRNA expression by RT-PCR. Similar results were obtained from three independent experiments.
FIGURE 7.
FIGURE 7.
FGF2-induced Gdnf expression is suppressed in Egr-1−/− astrocytes. A and B, Egr-1+/− or Egr-1−/− astrocytes were treated with 10 ng/ml of FGF2 for various lengths of time, and total RNA was extracted. Egr-1 (A) or Gdnf (B) mRNA expressions were determined by RT-PCR. Similar results were obtained from three independent experiments. C, Egr-1+/− or Egr-1−/− astrocytes cultured on coverslips were treated with 10 ng/ml of FGF2 for 18 h. After incubation with anti-Gdnf (1:100) and anti-S100 (1:200) antibodies, the cells were examined under a confocal fluorescence microscope; red, Gdnf; green, S100. D, Egr-1+/− or Egr-1−/− astrocytes cultured in 24-well plates were incubated with or without 10 ng/ml of FGF2. After 48 h, the Gdnf concentration in the conditioned medium was measured using an enzyme-linked immunosorbent assay. The data represent the mean ± S.D. (error bars) of three independent experiments performed in triplicate. *, p < 0.05 compared with Egr-1+/− conditioned medium in the absence of FGF2; **, p < 0.01 (Student's t test).
FIGURE 8.
FIGURE 8.
Impairment of GdnF expression in the Egr-1−/− mouse brain. A, brain sections were prepared, stained with hematoxylin and eosin (upper panel), and immunostained with anti-Gdnf antibody (lower panels). Gdnf immunoreactive cells in the CA1, CA3, and dentate gyrus (DG) regions of the hippocampus (boxes in upper panel) are shown in the lower panels. Arrows indicate immunopositive cells. Scale bar, 500 μm. B, quantification of Gdnf-immunoreactive cells in the CA1, CA3, and dentate gyrus (DG) regions of an 8-month-old mouse brain. Values represent the mean ± S.D. (error bars). *, p < 0.05 (n = 6) for Egr-1+/− versus Egr-1−/− mice (one-way analysis of variance analysis).

Similar articles

Cited by

References

    1. Ullian E. M., Christopherson K. S., Barres B. A. (2004) Glia 47, 209–216 - PubMed
    1. Darlington C. L. (2005) Curr. Opin. Investig. Drug 6, 700–703 - PubMed
    1. Lin L. F., Doherty D. H., Lile J. D., Bektesh S., Collins F. (1993) Science 260, 1130–1132 - PubMed
    1. Pozas E., Ibáñez C. F. (2005) Neuron 45, 701–713 - PubMed
    1. Moore M. W., Klein R. D., Fariñas I., Sauer H., Armanini M., Phillips H., Reichardt L. F., Ryan A. M., Carver-Moore K., Rosenthal A. (1996) Nature 382, 76–79 - PubMed

Publication types

MeSH terms

Substances