

Paraquat toxicity induced by voltage-dependent anion channel 1 acts as an NADH-dependent oxidoreductase
- PMID: 19717555
- PMCID: PMC2781408
- DOI: 10.1074/jbc.M109.033431
Paraquat toxicity induced by voltage-dependent anion channel 1 acts as an NADH-dependent oxidoreductase
Abstract
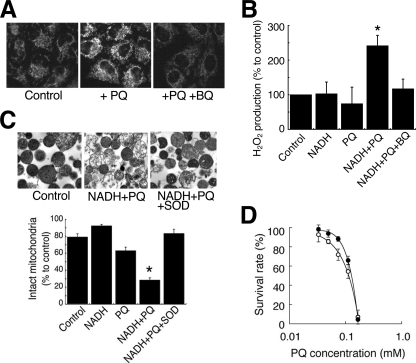
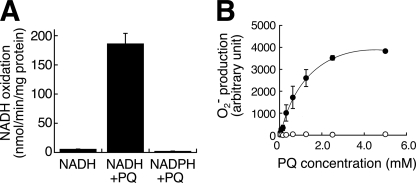
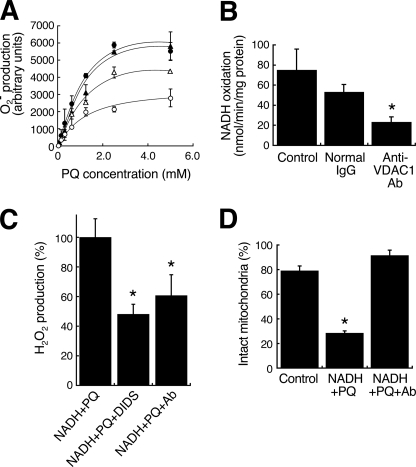
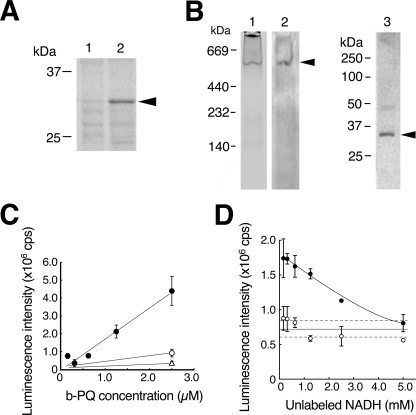
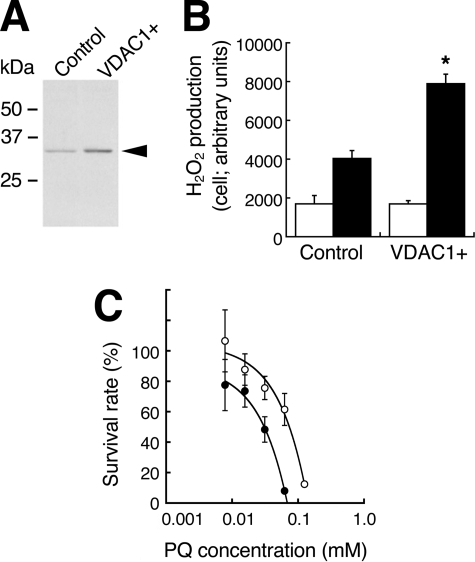
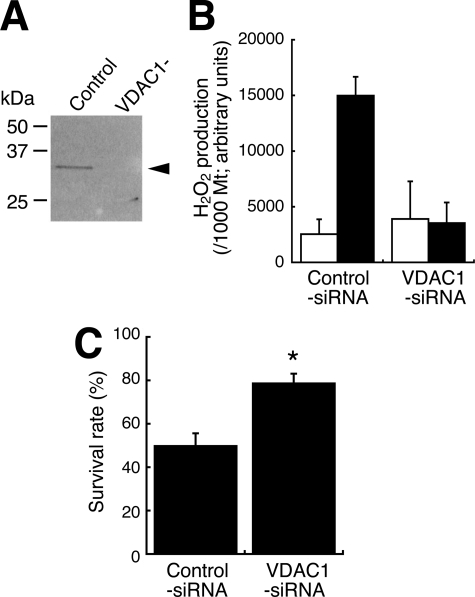
Paraquat (PQ), a herbicide used worldwide, causes fatal injury to organs upon high dose ingestion. Treatments for PQ poisoning are unreliable, and numerous deaths have been attributed inappropriate usage of the agent. It is generally speculated that a microsomal drug-metabolizing enzyme system is responsible for PQ toxicity. However, recent studies have demonstrated cytotoxicity via mitochondria, and therefore, the cytotoxic mechanism remains controversial. Here, we demonstrated that mitochondrial NADH-dependent PQ reductase containing a voltage-dependent anion channel 1 (VDAC1) is responsible for PQ cytotoxicity. When mitochondria were incubated with NADH and PQ, superoxide anion (O(2)(*)) was produced, and the mitochondria ruptured. Outer membrane extract oxidized NADH in a PQ dose-dependent manner, and oxidation was suppressed by VDAC inhibitors. Zymographic analysis revealed the presence of VDAC1 protein in the oxidoreductase, and the direct binding of PQ to VDAC1 was demonstrated using biotinylated PQ. VDAC1-overexpressing cells showed increased O(2)(*) production and cytotoxicity, both of which were suppressed in VDAC1 knockdown cells. These results indicated that a VDAC1-containing mitochondrial system is involved in PQ poisoning. These insights into the mechanism of PQ poisoning not only demonstrated novel physiological functions of VDAC protein, but they may facilitate the development of new therapeutic approaches.
Figures
Similar articles
-
Mitochondrial NADH-quinone oxidoreductase of the outer membrane is responsible for paraquat cytotoxicity in rat livers.Arch Biochem Biophys. 1998 Mar 1;351(1):75-81. doi: 10.1006/abbi.1997.0557. Arch Biochem Biophys. 1998. PMID: 9500851
-
External mitochondrial NADH-dependent reductase of redox cyclers: VDAC1 or Cyb5R3?Free Radic Biol Med. 2014 Sep;74:74-84. doi: 10.1016/j.freeradbiomed.2014.06.005. Epub 2014 Jun 16. Free Radic Biol Med. 2014. PMID: 24945955
-
Bioreductive activation of quinone antitumor drugs by mitochondrial voltage-dependent anion channel 1.Anat Sci Int. 2008 Dec;83(4):261-6. doi: 10.1111/j.1447-073X.2008.00241.x. Anat Sci Int. 2008. PMID: 19159355
-
New insights into antioxidant strategies against paraquat toxicity.Free Radic Res. 2014 Jun;48(6):623-40. doi: 10.3109/10715762.2014.899694. Epub 2014 Mar 27. Free Radic Res. 2014. PMID: 24593876 Review.
-
Voltage-dependent anion-selective channel 1 (VDAC1)--a mitochondrial protein, rediscovered as a novel enzyme in the plasma membrane.Int J Biochem Cell Biol. 2005 Feb;37(2):277-82. doi: 10.1016/j.biocel.2004.05.013. Int J Biochem Cell Biol. 2005. PMID: 15474974 Review.
Cited by
-
Surveillance-activated defenses block the ROS-induced mitochondrial unfolded protein response.PLoS Genet. 2013;9(3):e1003346. doi: 10.1371/journal.pgen.1003346. Epub 2013 Mar 14. PLoS Genet. 2013. PMID: 23516373 Free PMC article.
-
Effect of glutathione administration on serum levels of reactive oxygen metabolites in patients with paraquat intoxication: a pilot study.Korean J Intern Med. 2010 Sep;25(3):282-7. doi: 10.3904/kjim.2010.25.3.282. Epub 2010 Aug 31. Korean J Intern Med. 2010. PMID: 20830225 Free PMC article.
-
Genetic modification of the association of paraquat and Parkinson's disease.Mov Disord. 2012 Nov;27(13):1652-8. doi: 10.1002/mds.25216. Epub 2012 Oct 8. Mov Disord. 2012. PMID: 23045187 Free PMC article.
-
The antidote effect of quinone oxidoreductase 2 inhibitor against paraquat-induced toxicity in vitro and in vivo.Br J Pharmacol. 2013 Jan;168(1):46-59. doi: 10.1111/j.1476-5381.2012.01870.x. Br J Pharmacol. 2013. PMID: 22289031 Free PMC article.
-
Precocene II, a Trichothecene Production Inhibitor, Binds to Voltage-Dependent Anion Channel and Increases the Superoxide Level in Mitochondria of Fusarium graminearum.PLoS One. 2015 Aug 6;10(8):e0135031. doi: 10.1371/journal.pone.0135031. eCollection 2015. PLoS One. 2015. PMID: 26248339 Free PMC article.
References
-
- Wesseling C., van Wendel de Joode B., Ruepert C., León C., Monge P., Hermosillo H., Partanen T. J. (2001) Int. J. Occup. Environ. Health 7, 275–286 - PubMed
-
- Dinis-Oliveira R. J., Duarte J. A., Sánchez-Navarro A., Remião F., Bastos M. L., Carvalho F. (2008) Crit. Rev. Toxicol. 38, 13–71 - PubMed
-
- McCormack A. L., Thiruchelvam M., Manning-Bog A. B., Thiffault C., Langston J. W., Cory-Slechta D. A., Di Monte D. A. (2002) Neurobiol. Dis. 10, 119–127 - PubMed
-
- Baldwin R. C., Pasi A., MacGregor J. T., Hine C. H. (1975) Toxicol. Appl. Pharmacol. 32, 298–304 - PubMed
-
- Bus J. S., Cagen S. Z., Olgaard M., Gibson J. E. (1976) Toxicol. Appl. Pharmacol. 35, 501–513 - PubMed
Publication types
MeSH terms
Substances
Grants and funding
LinkOut - more resources
Full Text Sources
Research Materials
