. 2009 Sep;128(1):58-68.
doi: 10.1111/j.1365-2567.2009.03071.x.

A central role for monocytes in Toll-like receptor-mediated activation of the vasculature

Affiliations

A central role for monocytes in Toll-like receptor-mediated activation of the vasculature

Jon R Ward et al. Immunology. 2009 Sep.

Abstract

There is increasing evidence that activation of inflammatory responses in a variety of tissues is mediated co-operatively by the actions of more than one cell type. In particular, the monocyte has been implicated as a potentially important cell in the initiation of inflammatory responses to Toll-like receptor (TLR)-activating signals. To determine the potential for monocyte-regulated activation of tissue cells to underpin inflammatory responses in the vasculature, we established cocultures of primary human endothelial cells and monocytes and dissected the inflammatory responses of these systems following activation with TLR agonists. We observed that effective activation of inflammatory responses required bidirectional signalling between the monocyte and the tissue cell. Activation of cocultures was dependent on interleukin-1 (IL-1). Although monocyte-mediated IL-1beta production was crucial to the activation of cocultures, TLR specificity to these responses was also provided by the endothelial cells, which served to regulate the signalling of the monocytes. TLR4-induced IL-1beta production by monocytes was increased by TLR4-dependent endothelial activation in coculture, and was associated with increased monocyte CD14 expression. Activation of this inflammatory network also supported the potential for downstream monocyte-dependent T helper type 17 activation. These data define co-operative networks regulating inflammatory responses to TLR agonists, identify points amenable to targeting for the amelioration of vascular inflammation, and offer the potential to modify atherosclerotic plaque instability after a severe infection.


Figures

Figure 1
Figure 1
Differential release of cytokines from lipopolysaccharide (LPS)-treated endothelial cell (EC)/monocyte cocultures. Cocultures of EC and monocytes were formed, stimulated with LPS for 24 hr, and their production of cytokines was measured by enzyme-linked immunosorbent assay (ELISA). (a–c) LPS-treated EC/monocyte cocultures released more interleukin-6 (IL-6) (a), CXCL-8 (b) and interleukin-1β (IL-1β) (c) than either cell type alone. (d) LPS-treated EC/monocyte cocultures released less tumour necrosis factor-α (TNF-α) than LPS-treated monocytes. M indicates monocytes, EC indicates EC and EC + M indicates EC/monocyte cocultures. Data are ± SEM (n = 5), with each experiment using cells from independent human umbilical vein EC and monocyte donors. ***P < 0·001 and *P < 0·05, analysed using two-way anova with Bonferroni’s post-test. LD indicates the limit of detection of the ELISA.
Figure 2
Figure 2
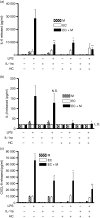
Inhibition of coculture activation reveals differential regulation of cytokine production. Cocultures of endothelial cells (EC) and monocytes were formed, stimulated with lipopolysaccharide (LPS; 10 ng/ml) for 24 hr, and their production of cytokines determined by enzyme-linked immunosorbent assay (ELISA). (a) Both interleukin-1 receptor anatagonist (IL-1ra) and hydrocortisone reduced the release of IL-6 from the LPS-treated cocultures. (b) Hydrocortisone, but not IL-1ra, reduced the release of IL-1β from the LPS-treated cocultures. (c) Both IL-1ra and hydrocortisone reduced the release of CXCL8 from the LPS-treated cocultures. M indicates monocytes, EC indicates EC and EC + M indicates an EC/monocyte coculture. HC indicates hydrocortisone. Data are ± SEM (n = 4), with each experiment using cells from independent donors. **P < 0·01, and *P < 0·05, analysed using one-way anova with Tukey’s post-test. LD indicates the limit of detection of the ELISA.
Figure 3
Figure 3
Endothelial cells (EC) are a source of interleukin-6 (IL-6) but not IL-1β in the cocultures, whereas as monocytes are a source of both cytokines. Monocytes or EC were cultured in isolation, at the same densities and conditions as used in cocultures. Filled bars show IL-6 and IL-1β production after direct activation of monocytes or EC by the indicated concentrations of lipopolysaccharide (LPS). In open bars, supernatants from LPS-treated monocytes were transferred onto fresh EC, or vice versa. (a, b) Bar I indicates the effects of addition of supernatants (diluted one in two in fresh media) from buffer-treated monocytes on EC. Bars II and III indicate the addition of media from monocytes treated with 1 or 10 ng/ml LPS, respectively, similarly diluted 1 : 2 in fresh media. (a) Release of IL-6 from EC treated with media from LPS-stimulated monocytes, and (b) media from LPS-stimulated monocytes was unable to induce the release of IL-1β from EC. (c, d) Bar I indicates the addition of supernatants (diluted one in two in fresh media) from buffer-treated EC onto monocytes; bars II, III and IV indicate the addition of media from EC treated with 0·1, 1 or 10 ng/ml LPS, respectively, similarly diluted 1 : 2 in fresh media. (c, d) Media from LPS-treated EC enhanced the release of both IL-6 and IL-1β from monocytes. Data are ± SEM (n = 4–8), each experiment using cells from independent donors. **P < 0·01 and *P < 0·05 (comparing the indicated bars with cytokine levels generated by monocytes alone). ###P < 0·001, ##P < 0·01 and #P < 0·05 (comparing the indicated bars with cytokine levels generated by EC alone). Data were analysed using two-way anova with Bonferroni’s post-test. LD indicates the limit of detection of the enzyme-linked immunosorbent assay.
Figure 4
Figure 4
Pam3CSK4-treated endothelial cells (EC) do not induce interleukin-1β (IL-1β) release from monocytes. Cocultures of EC and monocytes were formed, stimulated with different concentrations of Pam3CSK4 or lipopolysacchairde (LPS; 10 ng/ml) for 24 hr, and their production of cytokines was determined by enzyme-linked immunosorbent assay (ELISA). (a, b) EC/monocyte cocultures treated with Pam3CSK4 do not show the increased release of IL-6 and IL-1β that was observed with LPS treatment. (c) Bar I indicates the addition of supernatants (diluted one in two in fresh media) from buffer-treated EC onto monocytes; bars II, III and IV indicate the addition of media from EC treated with 10, 100 or 1000 ng/ml Pam3CSK4, respectively, similarly diluted 1 : 2 in fresh media. (c) Media from Pam3CSK4-treated EC did not enhance the release of IL-1β from monocytes, unlike LPS. Data are ± SEM (n = 3–5). ***P < 0·001 and **P < 0·01 [comparing the indicated bars with cytokine levels generated by monocytes alone (a–c)]. ###P < 0·001 [comparing the indicated bars with cytokine levels generated by EC alone (c)]. Data were analysed using two-way anova with Bonferroni’s post-test (a, b), or one-way anova with Tukey’s post-test (c). Data are from four or five different human umbilical vein EC and monocyte donors. LD indicates the limit of detection of the ELISA.
Figure 6
Figure 6
Enhanced monocyte survival induced by endothelial cells (EC). Cell-free supernatants from EC stimulated with buffer or lipopolysaccharide (LPS; 1 ng/ml) were prepared. Monocytes were seeded at 100 000 cells/ml in 12-well plates and then treated for 24 hr with buffer or LPS (0·5 ng/ml), or the EC supernatants (at a one in two dilution, thus allowing a maximum transferred LPS of 0·5 ng/ml). Viable monocytes were identified by flow cytometry using forward/side scatter gating and annexin V staining, and quantified using CountBright Absolute Counting Beads. The data show that media from EC caused enhanced monocyte survival. Data are ± SEM (n = 5) for each condition. *P < 0·05 (in comparison to buffer-treated cells) and #P < 0·05 (in comparison to LPS-treated cells), analysed using one-way anova with Tukey’s post-test.
Figure 5
Figure 5
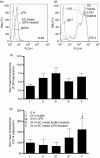
Enhancement of monocyte CD14, but not Toll-like receptor 4 (TLR4), surface expression by endothelial cells (EC). The EC were cultured in 12-well plates and treated with buffer or lipopolysaccharide (LPS; 1 ng/ml) for 24 hr, before collection of a cell-free supernatant, which was stored at −80° until required. Monocytes (cultured at 100 000 cells/ml) were treated for 24 hr with buffer or LPS (0·5 ng/ml), or media from EC that had been treated with buffer or LPS (at a one in two dilution, allowing a maximum transferred LPS of 0·5 ng/ml). Following this, expression of CD14 and TLR4 by the monocytes was determined by flow cytometry. (a) A typical histogram showing no change in surface TLR4 expression on monocytes and (b) an increase in CD14 expression when monocytes were treated with media from LPS-treated EC. Mean data are shown in (c, d). Data are ± SEM (n = 4–5) *P < 0·05 (in comparison to buffer-treated cells) and #P < 0·05 (in comparison to LPS-treated cells). Data were analysed using one-way anova with Tukey’s post-test.
Figure 7
Figure 7
Regulation of interleukin-17 (IL-17) release. The ability of cell-free supernatants from endothelial cells treated with either buffer or lipopolysaccharide (LPS) to support IL-17 production was determined. Lymphocytes were stimulated with anti-CD3 in coculture with monocytes and 100 ng/ml LPS, and the resulting IL-17 generation was measured by enzyme-linked immunosorbent assay. Addition of media from endothelial cells (EC) treated with buffer alone caused suppression of IL-17 generation from this activated coculture, whereas media from EC activated with 1 ng/ml LPS did not suppress IL-17 production. EC media were added at a 1 : 2 dilution. Data are ± SEM. Effects of supernatants from five EC donors, each treated with buffer or LPS, were tested on one monocyte/lymphocyte donor. *P < 0·05, analysed by t-test.

Similar articles

Cited by

References

    1. Morris GE, Parker LC, Ward JR, et al. Cooperative molecular and cellular networks regulate Toll-like receptor-dependent inflammatory responses. FASEB J. 2006;20:2153–5. - PubMed
    1. Morris GE, Whyte MKB, Martin GF, Jose PJ, Dower SK, Sabroe I. Agonists of Toll-like receptors 2 and 4 activate airway smooth muscle via mononuclear leukocytes. Am J Respir Crit Care Med. 2005;171:814–22. - PubMed
    1. Parker LC, Prestwich EC, Ward JR, Smythe E, Berry A, Triantafilou M, Triantafilou K, Sabroe I. A phosphatidylserine species inhibits a range of TLR, but not IL-1β, induced inflammatory responses by disruption of membrane microdomains. J Immunol. 2008;181:5606–17. - PMC - PubMed
    1. Chen CJ, Kono H, Golenbock D, Reed G, Akira S, Rock KL. Identification of a key pathway required for the sterile inflammatory response triggered by dying cells. Nat Med. 2007;13:851–6. - PubMed
    1. Rock KL, Kono H. The inflammatory response to cell death. Annu Rev Pathol. 2008;3:99–126. - PMC - PubMed

Publication types

MeSH terms