. 2009 Oct 16;393(1):98-112.
doi: 10.1016/j.jmb.2009.08.023. Epub 2009 Aug 14.

Structural basis of HIV-1 activation by NF-kappaB--a higher-order complex of p50:RelA bound to the HIV-1 LTR

Affiliations

Structural basis of HIV-1 activation by NF-kappaB--a higher-order complex of p50:RelA bound to the HIV-1 LTR

James C Stroud et al. J Mol Biol. .

Abstract

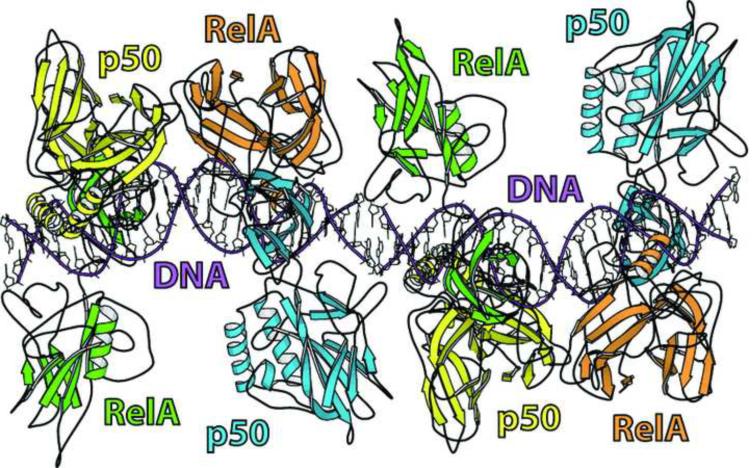
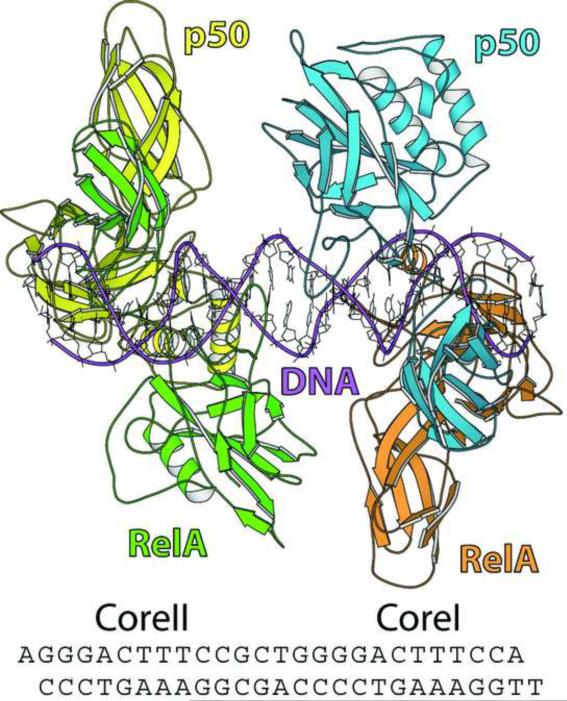
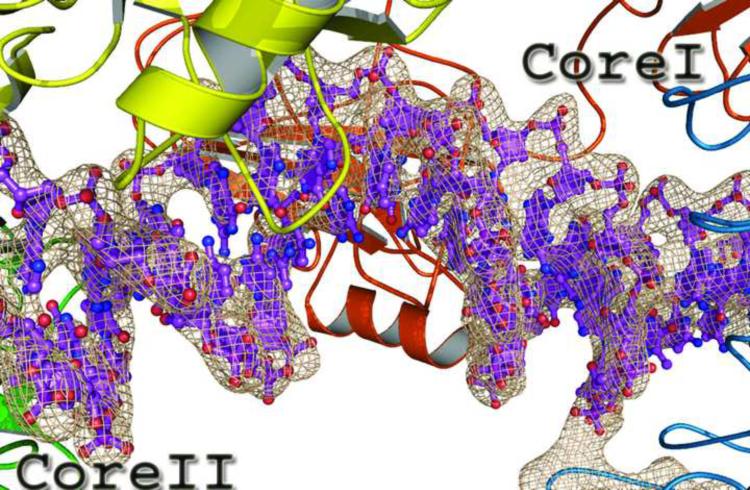
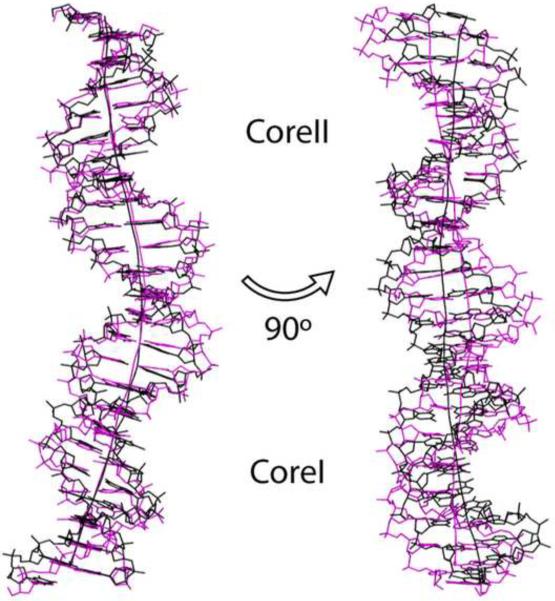
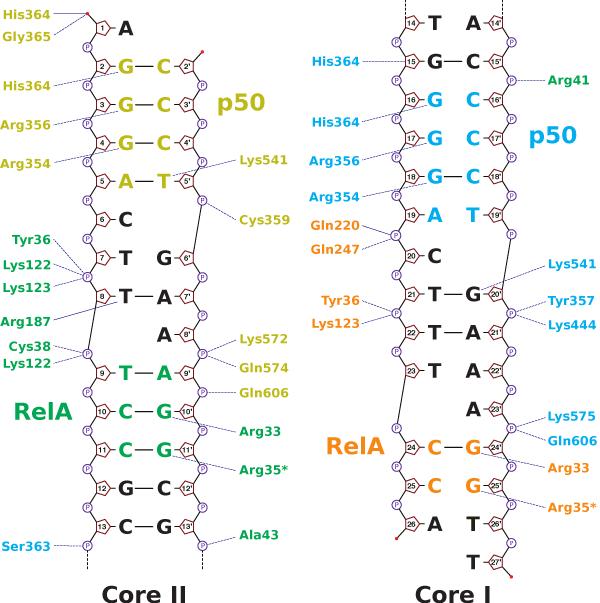
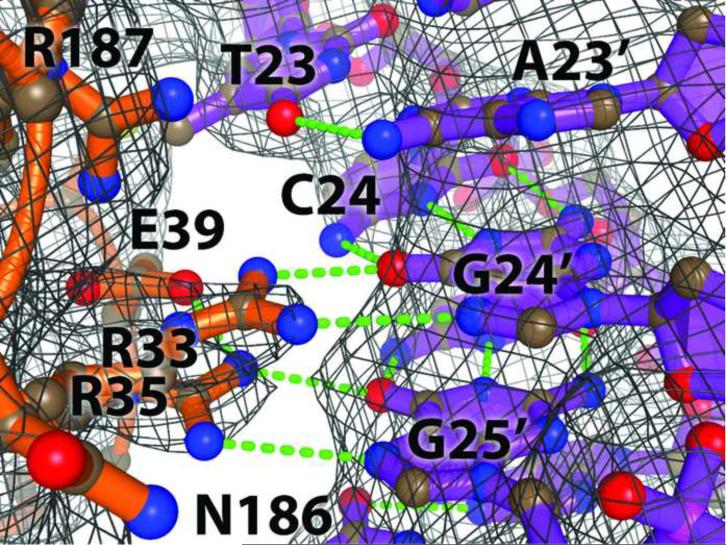
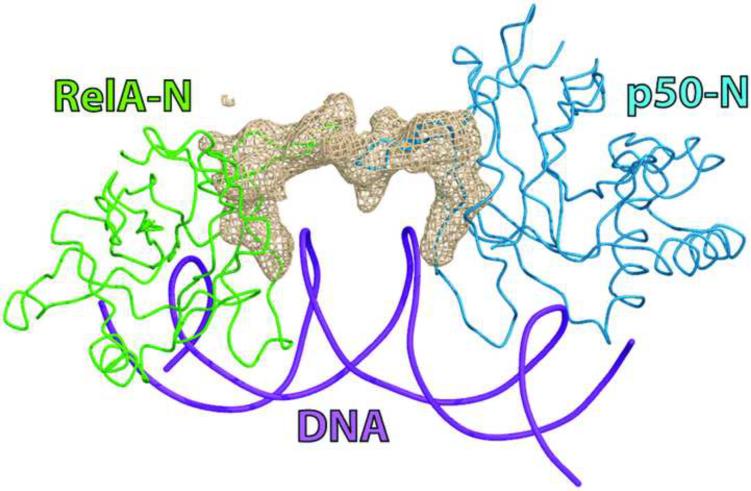
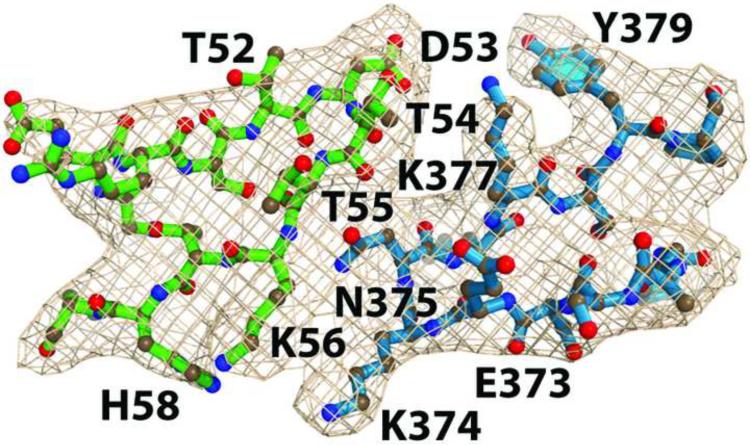
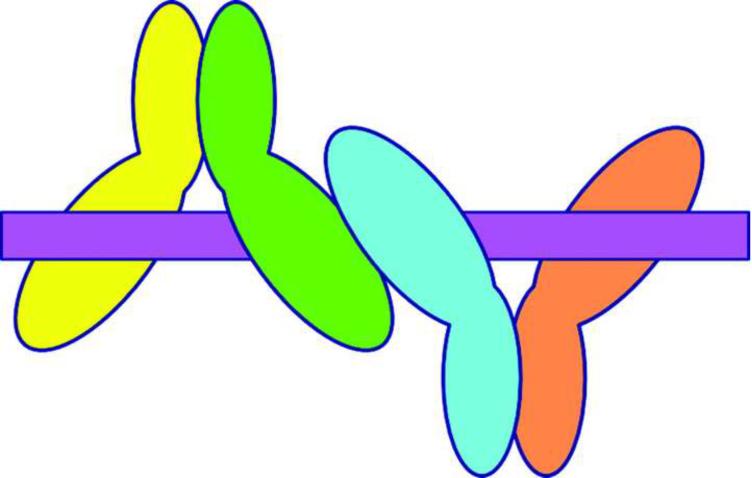
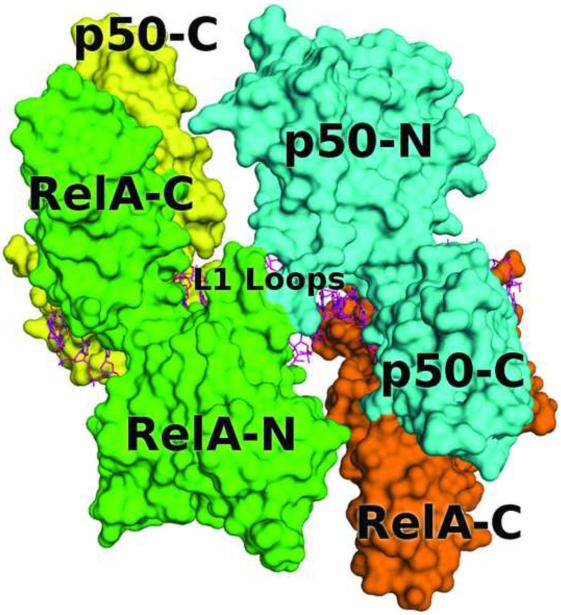
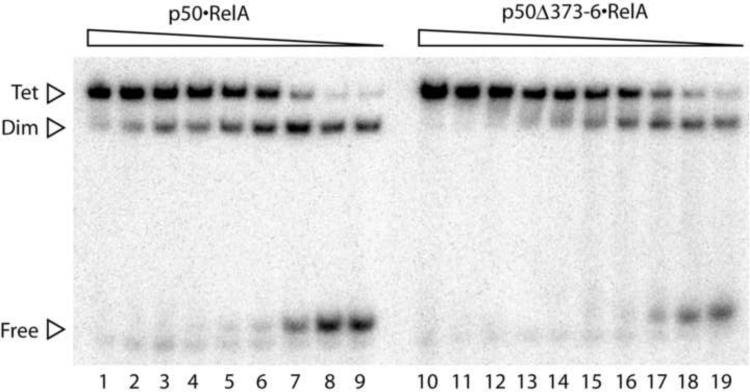
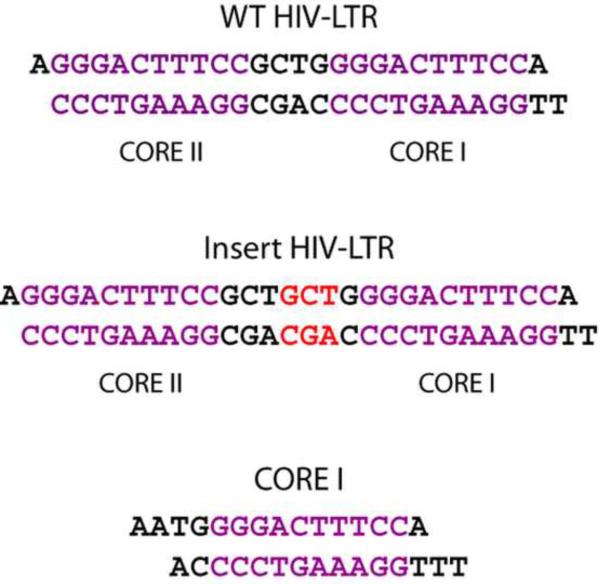
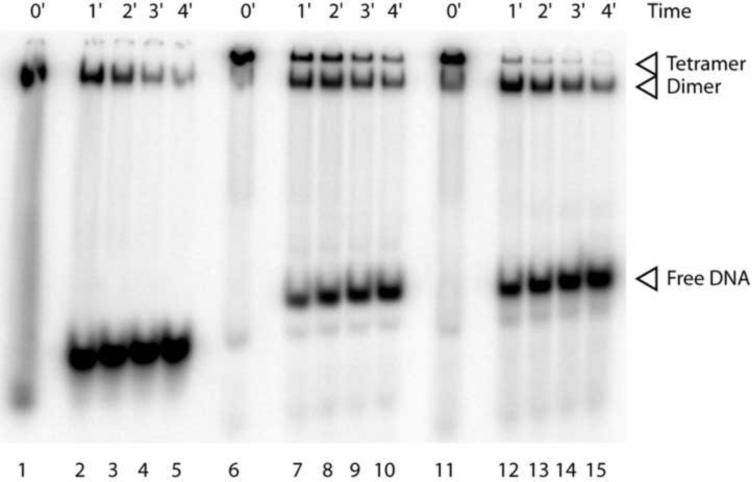
The activation and latency of human immunodeficiency virus type 1 (HIV-1) are tightly controlled by the transcriptional activity of its long terminal repeat (LTR) region. The LTR is regulated by viral proteins as well as host factors, including the nuclear factor kappaB (NF-kappaB) that becomes activated in virus-infected cells. The two tandem NF-kappaB sites of the LTR are among the most highly conserved sequence elements of the HIV-1 genome. Puzzlingly, these sites are arranged in a manner that seems to preclude simultaneous binding of both sites by NF-kappaB, although previous biochemical work suggests otherwise. Here, we have determined the crystal structure of p50:RelA bound to the tandem kappaB element of the HIV-1 LTR as a dimeric dimer, providing direct structural evidence that NF-kappaB can occupy both sites simultaneously. The two p50:RelA dimers bind the adjacent kappaB sites and interact through a protein contact that is accommodated by DNA bending. The two dimers clamp DNA from opposite faces of the double helix and form a topological trap of the bound DNA. Consistent with these structural features, our biochemical analyses indicate that p50:RelA binds the HIV-1 LTR tandem kappaB sites with an apparent anti-cooperativity but enhanced kinetic stability. The slow on and off rates we observe may be relevant to viral latency because viral activation requires sustained NF-kappaB activation. Furthermore, our work demonstrates that the specific arrangement of the two kappaB sites on the HIV-1 LTR can modulate the assembly kinetics of the higher-order NF-kappaB complex on the viral promoter. This phenomenon is unlikely restricted to the HIV-1 LTR but probably represents a general mechanism for the function of composite DNA elements in transcription.


Figures

Figure 1
Figure 1
Structure of the p50:RelA dimer bound to the tandem kappaB sites of the HIV-1 LTR (a) Asymmetric unit. The cyan and orange dimers are bound to the two copies of Core I and the yellow and green dimers are bound to Core II. Protein is shown in ribbons and DNA is shown as sticks with magenta ribbon tracing the phosphate backbone. Yellow: p50 on Core II, green: RelA on Core II, cyan: p50 on Core I, orange: RelA on Core I. (b) Biological unit. Protein and DNA representations are as in Figure 1a. The sequence of the DNA is shown below the structure.
Figure 1
Figure 1
Structure of the p50:RelA dimer bound to the tandem kappaB sites of the HIV-1 LTR (a) Asymmetric unit. The cyan and orange dimers are bound to the two copies of Core I and the yellow and green dimers are bound to Core II. Protein is shown in ribbons and DNA is shown as sticks with magenta ribbon tracing the phosphate backbone. Yellow: p50 on Core II, green: RelA on Core II, cyan: p50 on Core I, orange: RelA on Core I. (b) Biological unit. Protein and DNA representations are as in Figure 1a. The sequence of the DNA is shown below the structure.
Figure 2
Figure 2
Comparison of the p50:RelA dimer bound to Core I, Core II, and an Ig kappaB site. The dimers are aligned by least-squares fitting of their C-terminal domains. Yellow: p50 on Core II, green: RelA on Core II, cyan: p50 on Core I, orange: RelA on Core I. The p50:RelA dimer on the isolated Ig kappaB site is colored in gray. The p50 and RelA subunits are labeled together with their N- and C-termini. The p50 subunit is on the right and the RelA subunit is on the right and p50 is on the left. The DNA is omitted in this view.
Figure 3
Figure 3
DNA structure and indirect readout by the p50:RelA dimer on the HIV-1 LTR (a) Electron density of DNA in the region of the bend. The sigma-a weighted DNA density is well defined. Knobs in the density, observable around the tetrahedrally arranged red oxygen atoms which correspond to backbone phosphate groups, combined with the absence of a knob at the 5' ends of the DNA (not shown) establish two possible orientations of the DNA in the asymmetric unit. General agreement with the base density combined with prior knowledge of protein-DNA recognition disambiguates these two possibilities. The DNA is colored in magenta. Yellow: p50 on Core II, green: RelA on Core II, cyan: p50 on Core I, orange: RelA on Core I. (b) Comparison of the LTR tandem kappaB DNA from the NFAT1 (black) and NF-kappaB (magenta) bound structures . The DNA was aligned by least squares fitting of the phosphorous atoms of both DNAs. The superposed DNA on the left are oriented to show the direction of the largest bend. In this direction, the bend (shown as an axis made by a five point spline by CURVES) of the two DNAs follow each other nearly perfectly. The DNA on the right are rotated 90 degree around the vertical axis of the illustration. Core I is oriented towards the bottom of the figure and Core II is towards the top. (c) Sigma-a weighted 3fo2fc density at 3 e/Å3 in the region between p50 and RelA on Core II. Proteins are excluded from the figure for clarity. Hydrogen bonding inferred from Watson-Crick pairing is shown as green dashes for visual reference although the resolution does not allow assignment of hydrogen bonding.
Figure 3
Figure 3
DNA structure and indirect readout by the p50:RelA dimer on the HIV-1 LTR (a) Electron density of DNA in the region of the bend. The sigma-a weighted DNA density is well defined. Knobs in the density, observable around the tetrahedrally arranged red oxygen atoms which correspond to backbone phosphate groups, combined with the absence of a knob at the 5' ends of the DNA (not shown) establish two possible orientations of the DNA in the asymmetric unit. General agreement with the base density combined with prior knowledge of protein-DNA recognition disambiguates these two possibilities. The DNA is colored in magenta. Yellow: p50 on Core II, green: RelA on Core II, cyan: p50 on Core I, orange: RelA on Core I. (b) Comparison of the LTR tandem kappaB DNA from the NFAT1 (black) and NF-kappaB (magenta) bound structures . The DNA was aligned by least squares fitting of the phosphorous atoms of both DNAs. The superposed DNA on the left are oriented to show the direction of the largest bend. In this direction, the bend (shown as an axis made by a five point spline by CURVES) of the two DNAs follow each other nearly perfectly. The DNA on the right are rotated 90 degree around the vertical axis of the illustration. Core I is oriented towards the bottom of the figure and Core II is towards the top. (c) Sigma-a weighted 3fo2fc density at 3 e/Å3 in the region between p50 and RelA on Core II. Proteins are excluded from the figure for clarity. Hydrogen bonding inferred from Watson-Crick pairing is shown as green dashes for visual reference although the resolution does not allow assignment of hydrogen bonding.
Figure 4
Figure 4
Conservation of the DNA binding mechanism of p50:RelA dimer on the HIV-1 LTR (a) Schematic of protein-DNA interactions. All assignments are by NUCPLOT . Protein residues are colored as following: yellow, p50 of Core II; green, RelA of Core II; cyan, p50 of Core I; orange: RelA of Core I. The binding sites on the DNA are colored according to their cognate protein. Lines between bases represent proximity of the bases close enough to allow Watson-Crick hydrogen bonding, but do not necessarily represent actual Watson-Crick bonding as the resolution does not allow specific assignment of hydrogen bonds. (b) Sigma-a weighted 3fo2fc electron density of p50-Core I protein-DNA recognition at 0.5 e/Å3. The presence of clear electron density for several key head-groups, such as Arg354, Arg356, and His364, helps to establish that the protein in this area is p50 (cyan). Hydrogen bonding is assigned using prior knowledge of p50-DNA recognition and is shown as green dashes . Density is shown as grey mesh. (c) Sigma-a weighted 3fo2fc electron density of RelA-Core I protein-DNA recognition at 0.5 e/Å3. The presence of clear electron density for several key head-groups, such as Arg33 and Arg35 helps to establish that the protein in this area is RelA (orange). Hydrogen bonding is assigned using prior knowledge of RelA-DNA recognition and is shown as green dashes. Density is shown as grey mesh.
Figure 4
Figure 4
Conservation of the DNA binding mechanism of p50:RelA dimer on the HIV-1 LTR (a) Schematic of protein-DNA interactions. All assignments are by NUCPLOT . Protein residues are colored as following: yellow, p50 of Core II; green, RelA of Core II; cyan, p50 of Core I; orange: RelA of Core I. The binding sites on the DNA are colored according to their cognate protein. Lines between bases represent proximity of the bases close enough to allow Watson-Crick hydrogen bonding, but do not necessarily represent actual Watson-Crick bonding as the resolution does not allow specific assignment of hydrogen bonds. (b) Sigma-a weighted 3fo2fc electron density of p50-Core I protein-DNA recognition at 0.5 e/Å3. The presence of clear electron density for several key head-groups, such as Arg354, Arg356, and His364, helps to establish that the protein in this area is p50 (cyan). Hydrogen bonding is assigned using prior knowledge of p50-DNA recognition and is shown as green dashes . Density is shown as grey mesh. (c) Sigma-a weighted 3fo2fc electron density of RelA-Core I protein-DNA recognition at 0.5 e/Å3. The presence of clear electron density for several key head-groups, such as Arg33 and Arg35 helps to establish that the protein in this area is RelA (orange). Hydrogen bonding is assigned using prior knowledge of RelA-DNA recognition and is shown as green dashes. Density is shown as grey mesh.
Figure 5
Figure 5
The two p50:RelA dimers form a topological trap of the DNA on the HIV-1 LTR (a) Simulated annealing omit fofc map of electron density at 1.5 e/Å3 in the region of the L1 loops. The N-terminal domain of p50 on Core I (cyan) and RelA on Core II (green) are shown as backbone traces. DNA is shown as a cartoon (magenta). This view shows clearly that the DNA bends underneath the L1 loops and away from the protein interface. (b) A zoom-in top view of the electron density map at the L1-L1 interface. A potential assignment of interacting residues was made based on the side chain features of bulky residues. Coloring is as in Figure 1a. (c) A schematic illustration of the topological trap formed by the two interacting p50:RelA dimers bound to the HIV-1 LTR tandem kappaB sites. (d) A surface model of the p50:RelA/HIV-1 LTR complex showing that the DNA is trapped by the higher-order protein complex. The orientation and coloring is the same as Figure 1b.
Figure 5
Figure 5
The two p50:RelA dimers form a topological trap of the DNA on the HIV-1 LTR (a) Simulated annealing omit fofc map of electron density at 1.5 e/Å3 in the region of the L1 loops. The N-terminal domain of p50 on Core I (cyan) and RelA on Core II (green) are shown as backbone traces. DNA is shown as a cartoon (magenta). This view shows clearly that the DNA bends underneath the L1 loops and away from the protein interface. (b) A zoom-in top view of the electron density map at the L1-L1 interface. A potential assignment of interacting residues was made based on the side chain features of bulky residues. Coloring is as in Figure 1a. (c) A schematic illustration of the topological trap formed by the two interacting p50:RelA dimers bound to the HIV-1 LTR tandem kappaB sites. (d) A surface model of the p50:RelA/HIV-1 LTR complex showing that the DNA is trapped by the higher-order protein complex. The orientation and coloring is the same as Figure 1b.
Figure 6
Figure 6
Truncation of the L1 loop of p50 reduces the anti-cooperativity of p50:RelA to the HIV-1 LTR Electrophoresis mobility shift assay of p50:RelA or p50Δ373–6:RelA bound to the HIV-1 LTR tandem kappaB sites. Protein is titrated in from right to left in 1.5 fold increases of protein concentration. Lane 9 contains 205 pM of p50:RelA. Lane 19 contains 479 pM of p50Δ373–6:RelA. The DNA concentration was kept at 35 pM for all binding reactions. Tet: dimeric heterodimer bound to DNA; Dim: heterodimer bound to DNA; Free: unbound DNA.
Figure 7
Figure 7
Kinetic analysis of the p50:RelA/HIV-1 LTR complex (a) DNA sequences used in this study. The p50:RelA sites are shown in violet and the inserted residues are in red. (b) Cold chase of radiolabeled complexes. Time with competitor (see Methods) is indicated above the lanes. Lanes 1–5: p50:RelA bound to isolated Core I only; lanes 6–10: p50:RelA bound to the wild type HIV-1 LTR tandem kappaB sites; lanes 11–15: p50:RelA bound to the HIV-1 LTR insert mutant. The dimeric heterodimer of p50:RelA is indicated as “Tetramer”. (c) Dissociation kinetics data. The ordinate, “Bt/B0”, is the fraction bound at time t divided by the fraction bound at time 0 s. The abcissa is the time with competitor DNA. The red curve is the dissociation of the p50:RelA heterodimer from the isolated Core I DNA. The blue curve is the dissociation of the dimeric heterodimer band from the HIV-1 LTR insert mutant. The green curve is the dissociation of the dimeric heterodimer band from the wild type HIV-1 LTR sequence.
Figure 7
Figure 7
Kinetic analysis of the p50:RelA/HIV-1 LTR complex (a) DNA sequences used in this study. The p50:RelA sites are shown in violet and the inserted residues are in red. (b) Cold chase of radiolabeled complexes. Time with competitor (see Methods) is indicated above the lanes. Lanes 1–5: p50:RelA bound to isolated Core I only; lanes 6–10: p50:RelA bound to the wild type HIV-1 LTR tandem kappaB sites; lanes 11–15: p50:RelA bound to the HIV-1 LTR insert mutant. The dimeric heterodimer of p50:RelA is indicated as “Tetramer”. (c) Dissociation kinetics data. The ordinate, “Bt/B0”, is the fraction bound at time t divided by the fraction bound at time 0 s. The abcissa is the time with competitor DNA. The red curve is the dissociation of the p50:RelA heterodimer from the isolated Core I DNA. The blue curve is the dissociation of the dimeric heterodimer band from the HIV-1 LTR insert mutant. The green curve is the dissociation of the dimeric heterodimer band from the wild type HIV-1 LTR sequence.

Similar articles

Cited by

References

    1. Nabel G, Baltimore D. An inducible transcription factor activates expression of human immunodeficiency virus in T cells. Nature. 1987;326:711–3. - PubMed
    1. Siekevitz M, Josephs SF, Dukovich M, Peffer N, Wong-Staal F, Greene WC. Activation of the HIV-1 LTR by T cell mitogens and the trans-activator protein of HTLV-I. Science. 1987;238:1575–8. - PubMed
    1. Weissman D, Barker TD, Fauci AS. The efficiency of acute infection of CD4+ T cells is markedly enhanced in the setting of antigen-specific immune activation. J Exp Med. 1996;183:687–92. - PMC - PubMed
    1. Levine BL, Mosca JD, Riley JL, Carroll RG, Vahey MT, Jagodzinski LL, Wagner KF, Mayers DL, Burke DS, Weislow OS, Louis DC, June CH. Antiviral effect and ex vivo CD4+ T cell proliferation in HIV-positive patients as a result of CD28 costimulation. Science. 1996;272:1939–43. - PubMed
    1. Pereira LA, Bentley K, Peeters A, Churchill MJ, Deacon NJ. A compilation of cellular transcription factor interactions with the HIV-1 LTR promoter. Nucleic Acids Res. 2000;28:663–8. - PMC - PubMed

Publication types

Associated data

LinkOut - more resources