

Acquired copy number alterations in adult acute myeloid leukemia genomes
- PMID: 19651600
- PMCID: PMC2716381
- DOI: 10.1073/pnas.0903091106
Acquired copy number alterations in adult acute myeloid leukemia genomes
Abstract
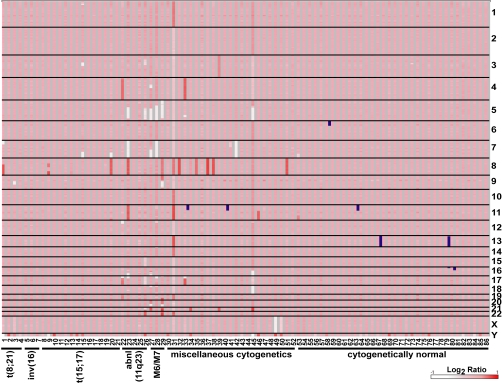
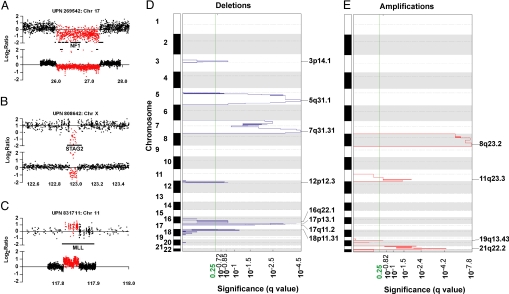
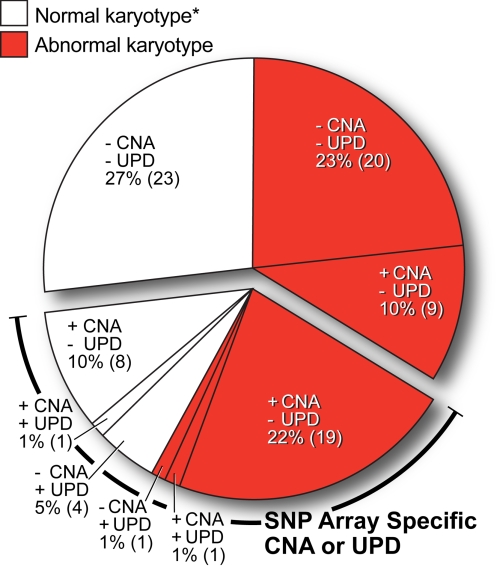
Cytogenetic analysis of acute myeloid leukemia (AML) cells has accelerated the identification of genes important for AML pathogenesis. To complement cytogenetic studies and to identify genes altered in AML genomes, we performed genome-wide copy number analysis with paired normal and tumor DNA obtained from 86 adult patients with de novo AML using 1.85 million feature SNP arrays. Acquired copy number alterations (CNAs) were confirmed using an ultra-dense array comparative genomic hybridization platform. A total of 201 somatic CNAs were found in the 86 AML genomes (mean, 2.34 CNAs per genome), with French-American-British system M6 and M7 genomes containing the most changes (10-29 CNAs per genome). Twenty-four percent of AML patients with normal cytogenetics had CNA, whereas 40% of patients with an abnormal karyotype had additional CNA detected by SNP array, and several CNA regions were recurrent. The mRNA expression levels of 57 genes were significantly altered in 27 of 50 recurrent CNA regions <5 megabases in size. A total of 8 uniparental disomy (UPD) segments were identified in the 86 genomes; 6 of 8 UPD calls occurred in samples with a normal karyotype. Collectively, 34 of 86 AML genomes (40%) contained alterations not found with cytogenetics, and 98% of these regions contained genes. Of 86 genomes, 43 (50%) had no CNA or UPD at this level of resolution. In this study of 86 adult AML genomes, the use of an unbiased high-resolution genomic screen identified many genes not previously implicated in AML that may be relevant for pathogenesis, along with many known oncogenes and tumor suppressor genes.
Conflict of interest statement
Conflict of interest: R.R.S., T.A.R., J.G., and J.K. are employees of Roche NimbleGen, Inc., which supplied the arrays and hybridization services for the research.
Figures
Similar articles
-
Identification of acquired copy number alterations and uniparental disomies in cytogenetically normal acute myeloid leukemia using high-resolution single-nucleotide polymorphism analysis.Leukemia. 2010 Feb;24(2):438-49. doi: 10.1038/leu.2009.263. Epub 2009 Dec 17. Leukemia. 2010. PMID: 20016533
-
Broad copy neutral-loss of heterozygosity regions and rare recurring copy number abnormalities in normal karyotype-acute myeloid leukemia genomes.Genes Chromosomes Cancer. 2010 Nov;49(11):1014-23. doi: 10.1002/gcc.20810. Genes Chromosomes Cancer. 2010. PMID: 20725993
-
Uniparental disomy may be associated with microsatellite instability in acute myeloid leukemia (AML) with a normal karyotype.Leuk Lymphoma. 2008 Jun;49(6):1178-83. doi: 10.1080/10428190802035941. Leuk Lymphoma. 2008. PMID: 18452069
-
Significance of genome-wide analysis of copy number alterations and UPD in myelodysplastic syndromes using combined CGH - SNP arrays.Curr Med Chem. 2012;19(22):3739-47. doi: 10.2174/092986712801661121. Curr Med Chem. 2012. PMID: 22680919 Review.
-
Genomic analysis of acute myeloid leukemia: potential for new prognostic indicators.Curr Opin Hematol. 2010 Mar;17(2):75-8. doi: 10.1097/MOH.0b013e3283366c43. Curr Opin Hematol. 2010. PMID: 20075726 Free PMC article. Review.
Cited by
-
The Polo-Like Kinase 1 (PLK1) inhibitor NMS-P937 is effective in a new model of disseminated primary CD56+ acute monoblastic leukaemia.PLoS One. 2013;8(3):e58424. doi: 10.1371/journal.pone.0058424. Epub 2013 Mar 8. PLoS One. 2013. PMID: 23520509 Free PMC article. Clinical Trial.
-
High-resolution genomic profiling of adult and pediatric core-binding factor acute myeloid leukemia reveals new recurrent genomic alterations.Blood. 2012 Mar 8;119(10):e67-75. doi: 10.1182/blood-2011-09-380444. Epub 2012 Jan 10. Blood. 2012. PMID: 22234698 Free PMC article.
-
ETV6 deletion is a common additional abnormality in patients with myelodysplastic syndromes or acute myeloid leukemia and monosomy 7.Haematologica. 2012 Dec;97(12):1933-6. doi: 10.3324/haematol.2012.069716. Epub 2012 Aug 8. Haematologica. 2012. PMID: 22875624 Free PMC article. No abstract available.
-
Optical genome mapping in acute myeloid leukemia: a multicenter evaluation.Blood Adv. 2023 Apr 11;7(7):1297-1307. doi: 10.1182/bloodadvances.2022007583. Blood Adv. 2023. PMID: 36417763 Free PMC article.
-
SNP Array in Hematopoietic Neoplasms: A Review.Microarrays (Basel). 2015 Dec 22;5(1):1. doi: 10.3390/microarrays5010001. Microarrays (Basel). 2015. PMID: 27600067 Free PMC article. Review.
References
-
- Byrd JC, et al. Pretreatment cytogenetic abnormalities are predictive of induction success, cumulative incidence of relapse, and overall survival in adult patients with de novo acute myeloid leukemia: Results from Cancer and Leukemia Group B (CALGB 8461) Blood. 2002;100:4325–4336. - PubMed
-
- Schlenk RF, et al. Mutations and treatment outcome in cytogenetically normal acute myeloid leukemia. N Engl J Med. 2008;358:1909–1918. - PubMed
-
- Fenaux P, et al. Effect of all transretinoic acid in newly diagnosed acute promyelocytic leukemia. Results of a multicenter randomized trial. Blood. 1993;82:3241–3249. - PubMed
-
- Mullighan CG, et al. Genome-wide analysis of genetic alterations in acute lymphoblastic leukaemia. Nature. 2007;446:758–764. - PubMed
MeSH terms
Substances
Grants and funding
LinkOut - more resources
Full Text Sources
Other Literature Sources
Medical
Molecular Biology Databases
