

doi: 10.1016/j.neuron.2009.06.009.
Midbrain dopamine neurons signal preference for advance information about upcoming rewards
Affiliations
- PMID: 19607797
- PMCID: PMC2723053
- DOI: 10.1016/j.neuron.2009.06.009
Item in Clipboard
Midbrain dopamine neurons signal preference for advance information about upcoming rewards
Neuron.
.
Abstract
The desire to know what the future holds is a powerful motivator in everyday life, but it is unknown how this desire is created by neurons in the brain. Here we show that when macaque monkeys are offered a water reward of variable magnitude, they seek advance information about its size. Furthermore, the same midbrain dopamine neurons that signal the expected amount of water also signal the expectation of information, in a manner that is correlated with the strength of the animal's preference. Our data show that single dopamine neurons process both primitive and cognitive rewards, and suggest that current theories of reward-seeking must be revised to include information-seeking.
Figures
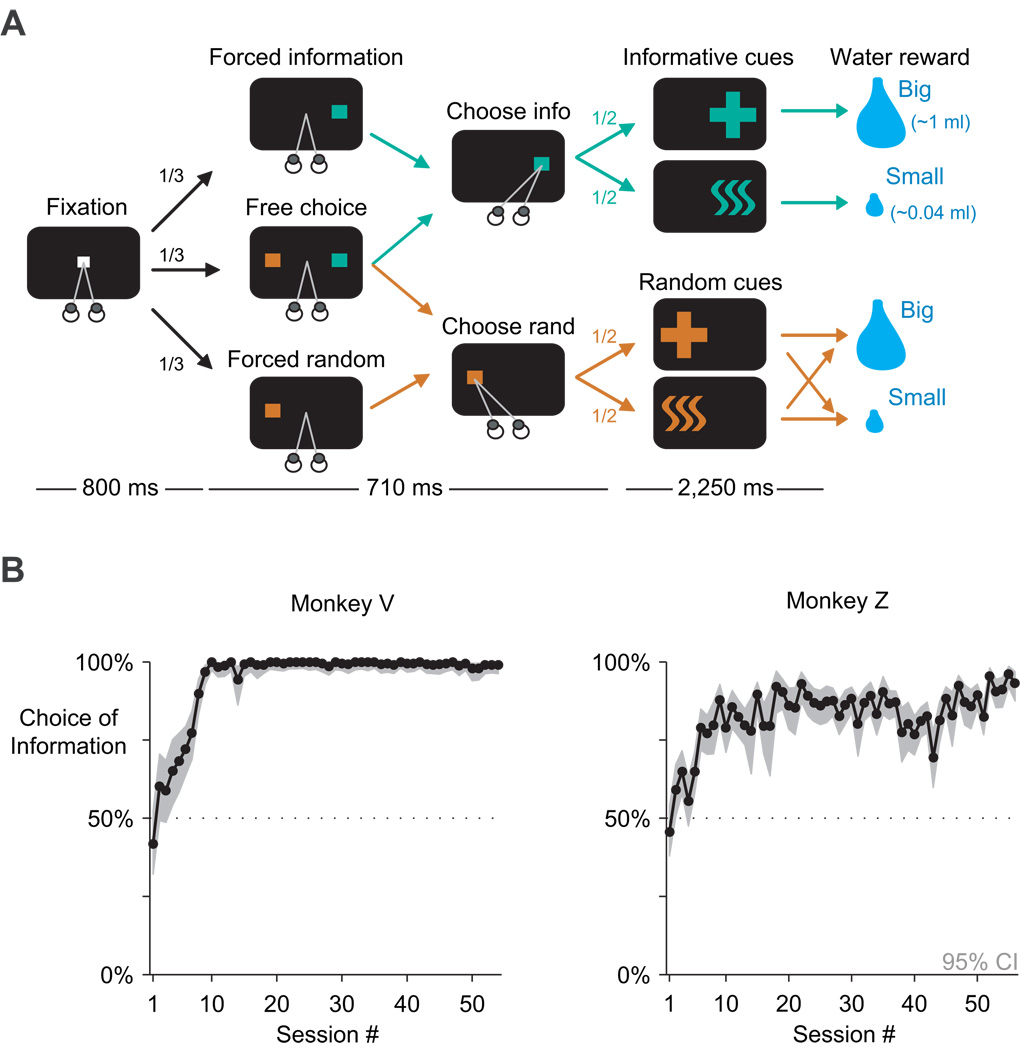
(A) Information choice task. Fractions represent probabilities of different trial types. (B) Percent choice of information for each monkey. Each dot represents a single day of training. The mean number of choice trials per session was 152 for monkey V (range: 71–203) and 161 for monkey Z (range: 39–285). The gray region is the Clopper-Pearson 95% confidence interval for each day.
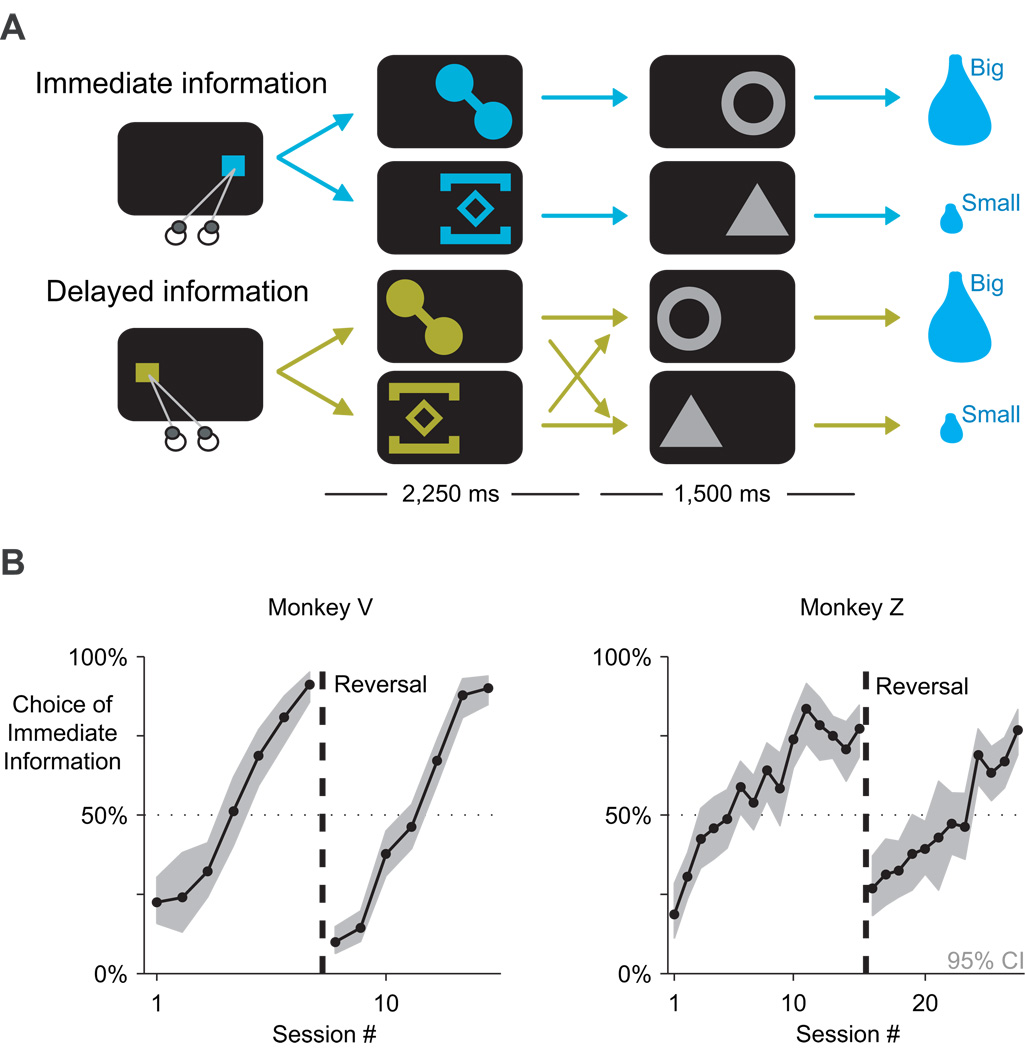
(A) Information delay task. The fixation point and target configurations (not shown here) were the same as in the information choice task shown in Figure 1A. (B) Percent choice of immediate information. Conventions as in Figure 1B. The vertical line labeled “reversal” marks the time when the informative and random cue colors were switched. The mean number of choice trials per session was 151 for monkey V (range: 50–222) and 111 for monkey Z (range: 35–176). The behavioral preference started below 50% because the cue colors were re-used from a pilot experiment; the informative color had been previously trained as random, and vice versa -(Figure S3).
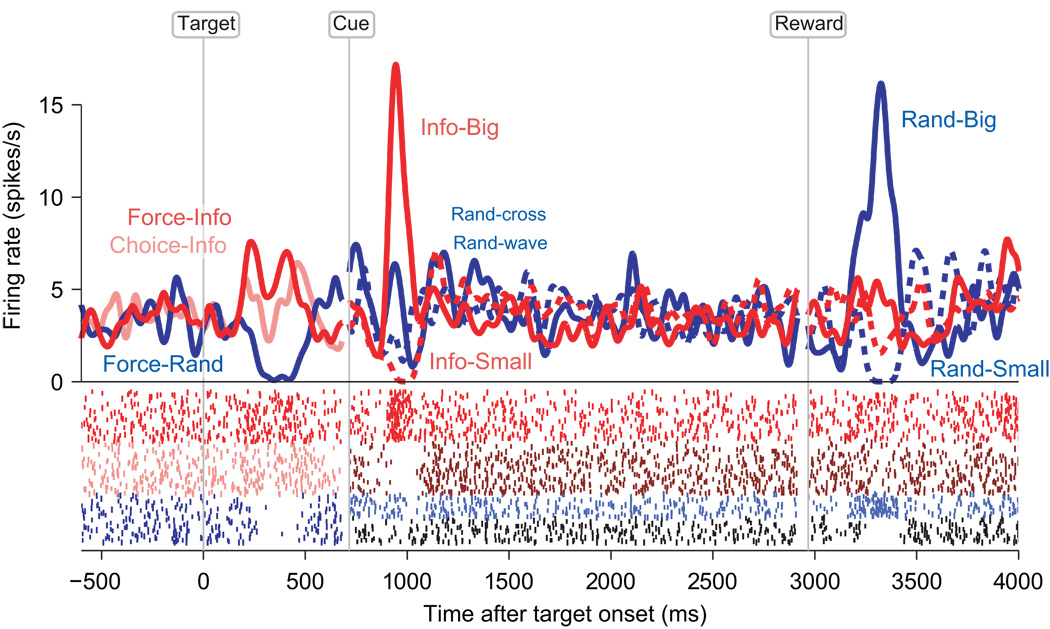
Top: firing rate of an example neuron. Trials are sorted separately for each task event, as follows. Target: forced-information (red), choice-information (pink), forced-random (blue). Cue: informative cues (red) indicating that the reward is big (solid) or small (dashed), random cues (blue) with the same shape as informative cues for big (solid,cross shape) or small (dashed, wave shape) rewards. Reward: informative (red) are the same trials as for the cue response, random (blue) trials where the reward was big (solid) or small (dashed). The firing rate was smoothed with a Gaussian kernel, σ = 20 ms. Bottom: rasters for individual trials. Each row is a trial, and each dot is a spike. Colors are the same as in the firing rate display, except that dark colors correspond to dashed lines.

(A) Population average firing rate. Conventions as in Figure 3. Gray bars indicate the time windows used for the ROC analysis. Colored bars indicate time points with a significant difference between selected pairs of task conditions (P < 0.01, Wilcoxon signed rank test), as follows. Target: force-info vs. force-rand (red), choice-info vs. force-rand (pink); Cue: info-big vs. info-small (red), rand-cross vs. rand-wave (blue); Reward: info-big vs. info-small (red), rand-big vs. rand-small (blue). (B–D) Neural discrimination between task conditions in response to the targets (B), cues (C), and rewards (D). Each dot’s (x,y) coordinates represent a single neuron’s ROC area for discriminating between the pairs of task conditions listed on the x and y axes. A discrimination of 1 indicates perfect preference for the condition listed next to “1” (e.g. “Choice info”); discrimination of zero indicates perfect preference for the condition listed next to “0” (e.g. “Force rand”). Note that in (B) the x and y coordinates were both calculated using the same set of forced-random trials. Colored dots indicate neurons with significant discrimination between the conditions listed on the y-axis (red), x-axis (blue), or both axes (magenta) (P < 0.05, Wilcoxon rank-sum test).
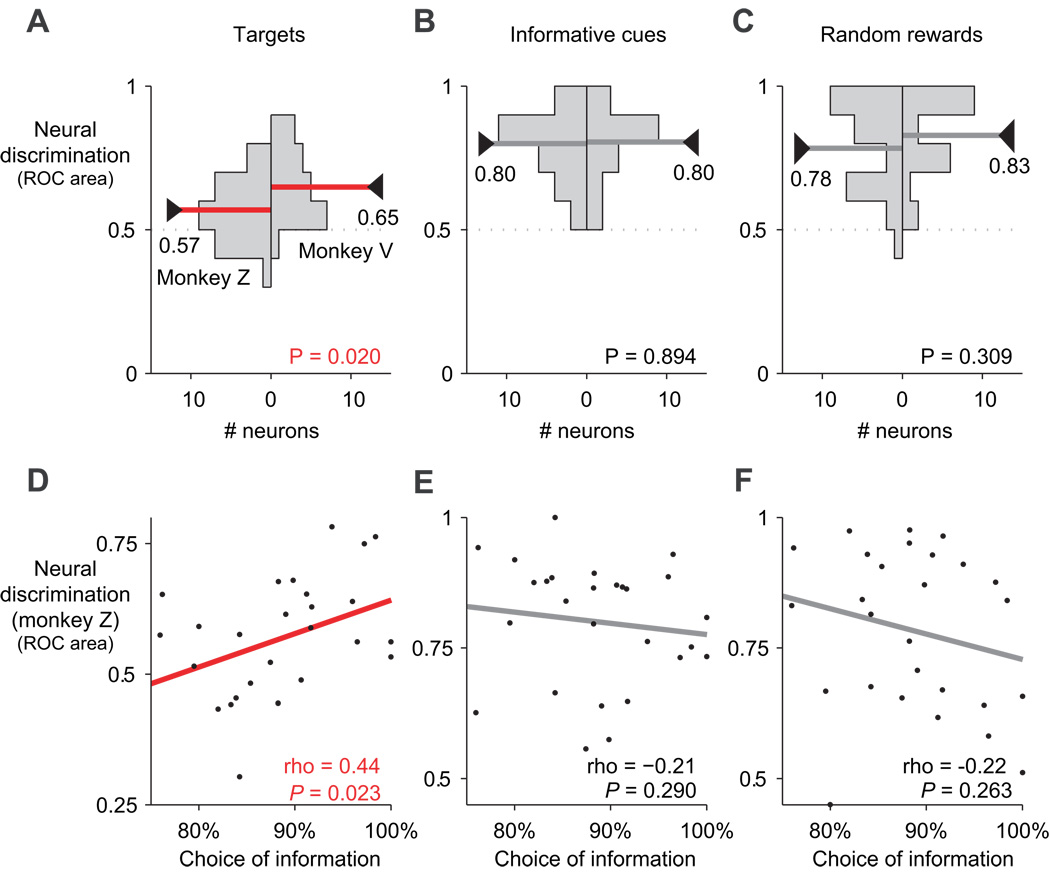
(A) Histogram of single-neuron target response discrimination between all informative trials (choice and forced trials combined) versus forced-random trials, separately for monkey V (left) and monkey Z (right). Arrows, numbers, and horizontal lines indicate the mean discrimination, and the width of the arrows represent the 95% bootstrap confidence interval. Red indicates statistical significance. (B,C) Same as (A), for discrimination between informative big-reward and small-reward cues (B) or between random big and small rewards (C). (D) Plot of behavioral choice percentage against single-neuron discrimination between all informative trials versus forced-random trials in response to the target. The line was fitted by least-squares regression. Text shows Spearman’s rank correlation (rho), and red indicates statistical significance. The data is from monkey Z only, because monkey V almost exclusively chose the informative target and therefore had no behavioral variability. (E-F) Same as (D), but for discrimination between informative big-reward and small-reward cues (E) or between random big and small rewards (F).
Similar articles
-
Midbrain dopamine neurons encode a quantitative reward prediction error signal.Neuron. 2005 Jul 7;47(1):129-41. doi: 10.1016/j.neuron.2005.05.020. Neuron. 2005. PMID: 15996553 Free PMC article.
-
Correlated coding of motivation and outcome of decision by dopamine neurons.J Neurosci. 2003 Oct 29;23(30):9913-23. doi: 10.1523/JNEUROSCI.23-30-09913.2003. J Neurosci. 2003. PMID: 14586021 Free PMC article.
-
Dissociable cost and benefit encoding of future rewards by mesolimbic dopamine.Nat Neurosci. 2010 Jan;13(1):25-7. doi: 10.1038/nn.2460. Epub 2009 Nov 10. Nat Neurosci. 2010. PMID: 19904261 Free PMC article.
-
Involvement of basal ganglia and orbitofrontal cortex in goal-directed behavior.Prog Brain Res. 2000;126:193-215. doi: 10.1016/S0079-6123(00)26015-9. Prog Brain Res. 2000. PMID: 11105648 Review.
-
Expectations and outcomes: decision-making in the primate brain.J Comp Physiol A Neuroethol Sens Neural Behav Physiol. 2005 Mar;191(3):201-11. doi: 10.1007/s00359-004-0565-9. Epub 2004 Oct 12. J Comp Physiol A Neuroethol Sens Neural Behav Physiol. 2005. PMID: 15759141 Review.
Cited by
-
Natural environments, ancestral diets, and microbial ecology: is there a modern "paleo-deficit disorder"? Part I.J Physiol Anthropol. 2015 Jan 31;34(1):1. doi: 10.1186/s40101-015-0041-y. J Physiol Anthropol. 2015. PMID: 25636731 Free PMC article. Review.
-
Neuronal Reward and Decision Signals: From Theories to Data.Physiol Rev. 2015 Jul;95(3):853-951. doi: 10.1152/physrev.00023.2014. Physiol Rev. 2015. PMID: 26109341 Free PMC article. Review.
-
Attention as a decision in information space.Trends Cogn Sci. 2010 Jun;14(6):240-8. doi: 10.1016/j.tics.2010.03.001. Epub 2010 Apr 17. Trends Cogn Sci. 2010. PMID: 20399701 Free PMC article. Review.
-
Dopamine neuron ensembles signal the content of sensory prediction errors.Elife. 2019 Nov 1;8:e49315. doi: 10.7554/eLife.49315. Elife. 2019. PMID: 31674910 Free PMC article.
-
Intervention changes acoustic peak frequency and mesolimbic neurochemistry in the Pink1-/- rat model of Parkinson disease.PLoS One. 2019 Aug 2;14(8):e0220734. doi: 10.1371/journal.pone.0220734. eCollection 2019. PLoS One. 2019. PMID: 31374106 Free PMC article.
References
-
- Ahlbrecht M, Weber M. The resolution of uncertainty: an experimental study. Journal of institutional and theoretical economics. 1996;152:593–607.
-
- Badia P, Harsh J, Abbott B. Choosing Between Predictable and Unpredictable Shock Conditions: Data and Theory. Psychological Bulletin. 1979;86:1107–1131.
-
- Barto AG, Singh SP, Chentanez N. Proceedings of the Thirteenth Yale Workshop on Adaptive and Learning Systems. CT, USA: New Haven; 2004. Intrinsically motivated learning of hierarchical collections of skills.
-
- Behrens TE, Woolrich MW, Walton ME, Rushworth MF. Learning the value of information in an uncertain world. Nat Neurosci. 2007;10:1214–1221. - PubMed
Publication types
MeSH terms
Substances
Grants and funding
LinkOut - more resources
Full Text Sources
Other Literature Sources
