. 2009 Jul 16;63(1):48-62.
doi: 10.1016/j.neuron.2009.06.006.

Fgf10 regulates transition period of cortical stem cell differentiation to radial glia controlling generation of neurons and basal progenitors

Affiliations

Fgf10 regulates transition period of cortical stem cell differentiation to radial glia controlling generation of neurons and basal progenitors

Setsuko Sahara et al. Neuron. .

Abstract

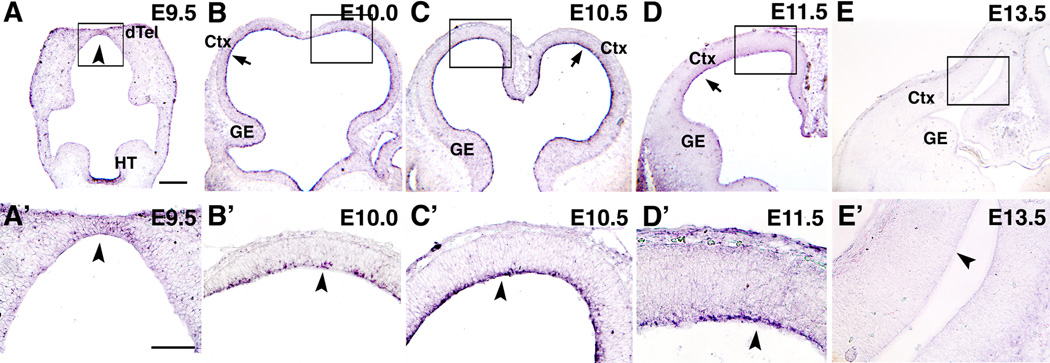
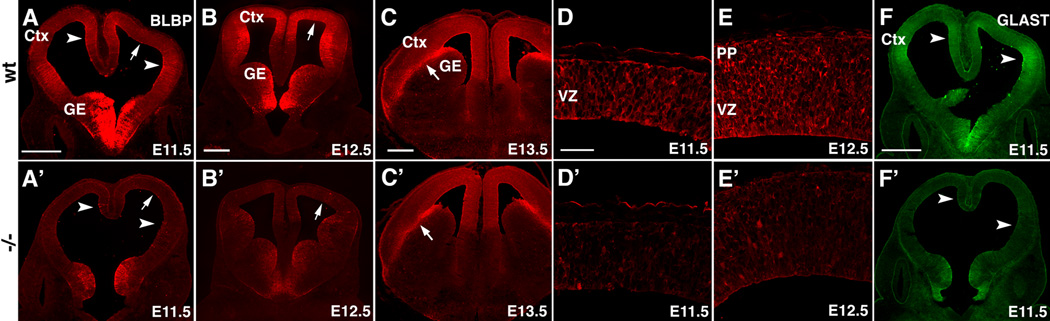
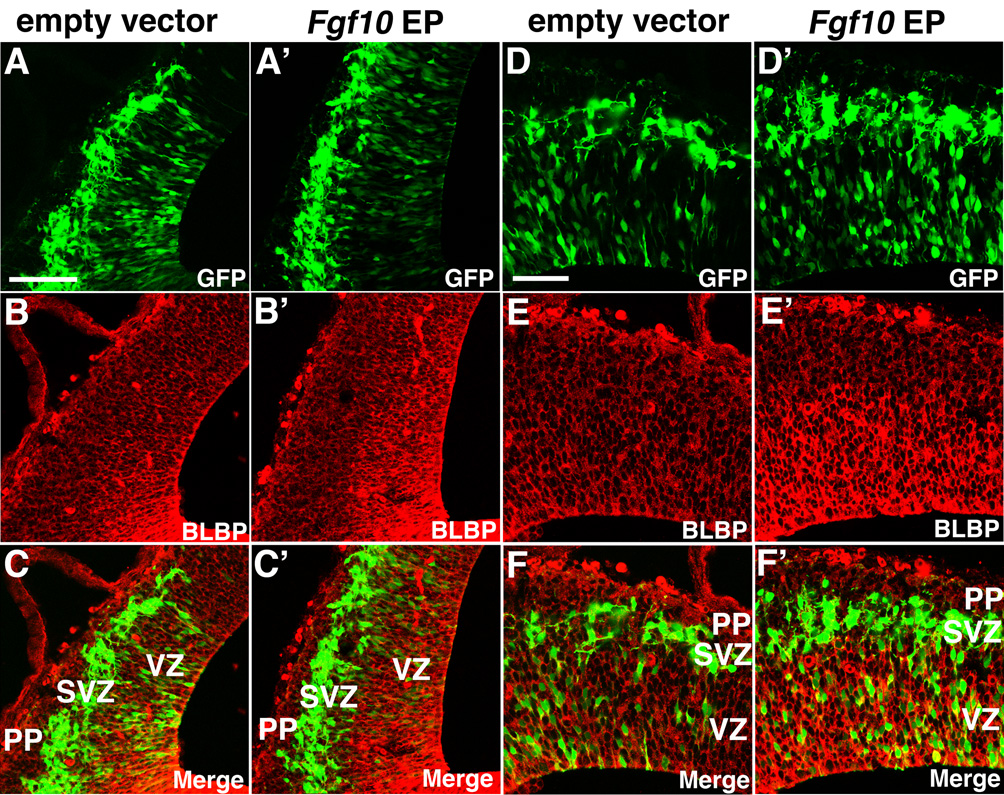
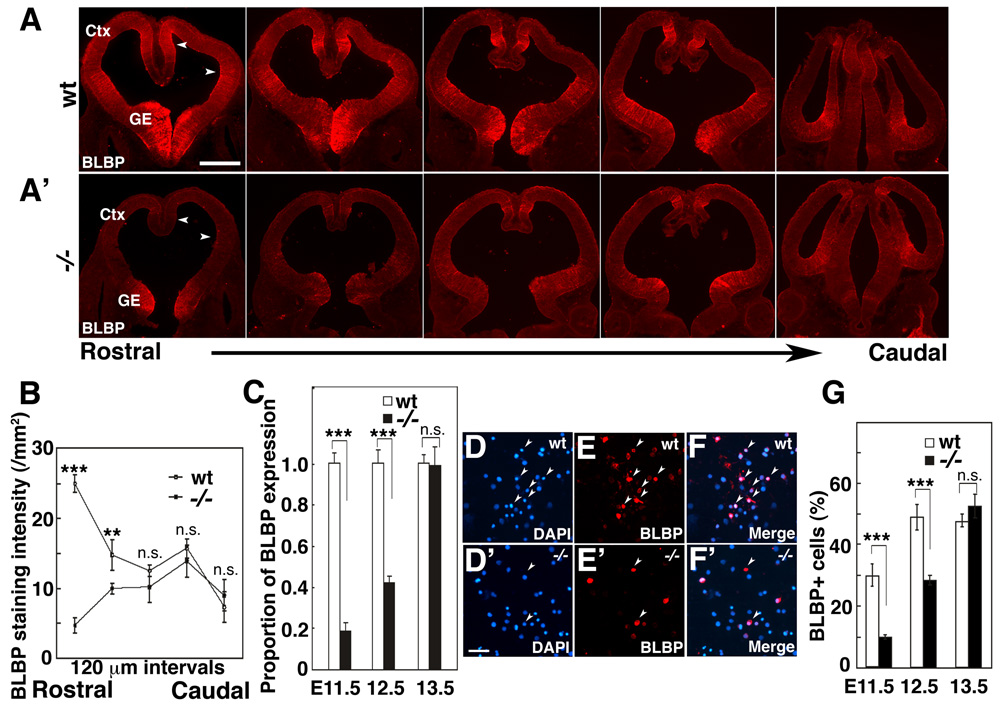
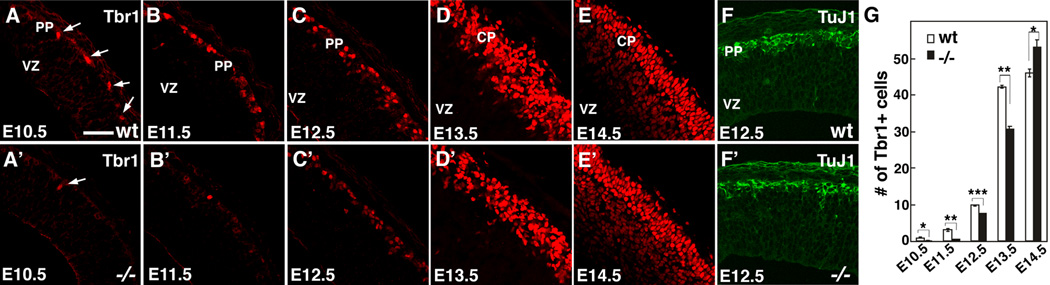
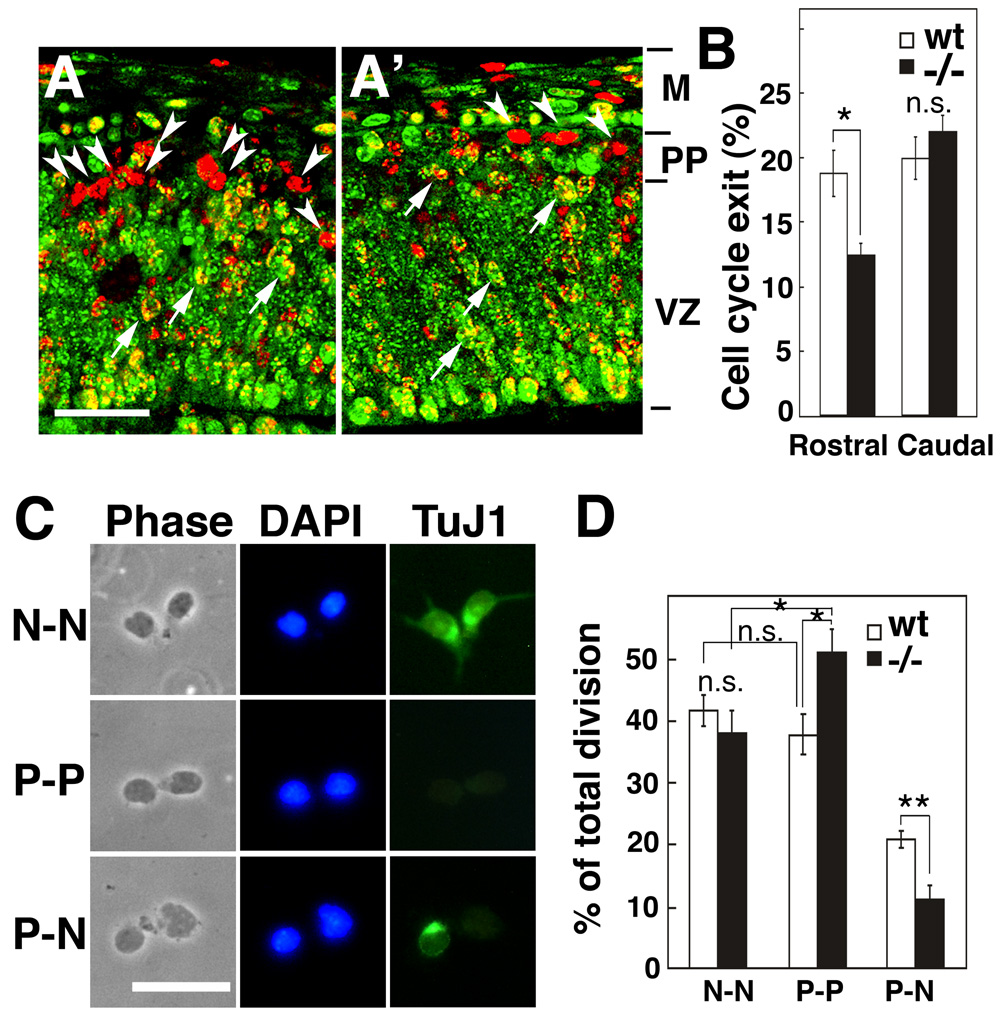
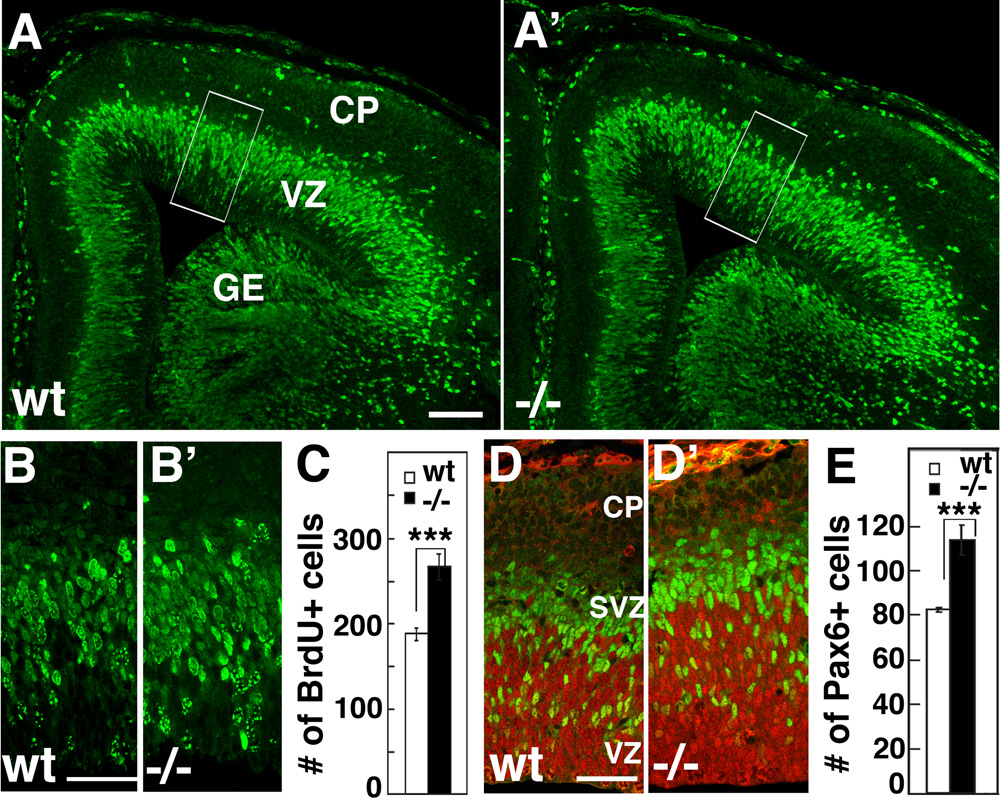
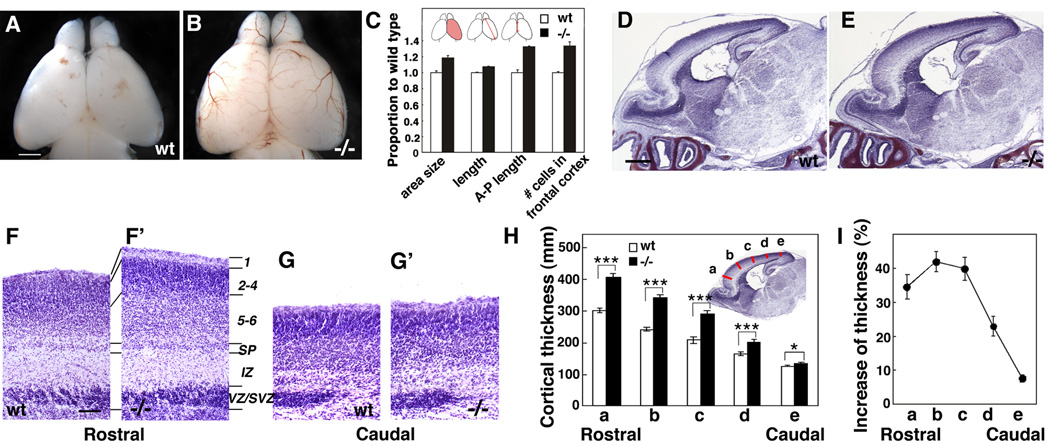
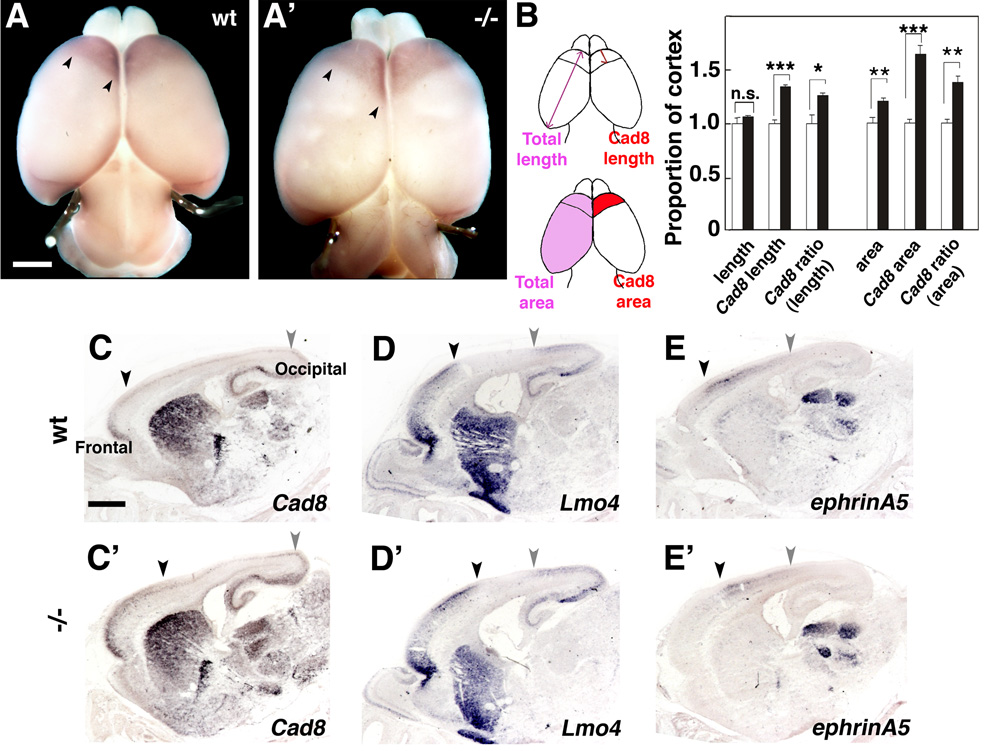
Radial glia (RG), the progenitors of cortical neurons and basal progenitors (BPs), differentiate from neuroepithelial cells (NCs) with stem cell properties. We show that the morphogen Fgf10 is transiently expressed by NCs coincident with the transition period of NC differentiation into RG. Targeted deletion of Fgf10 delays RG differentiation, whereas overexpression has opposing effects. Delayed RG differentiation in Fgf10 mutants occurs selectively in rostral cortex, paralleled by an extended period of symmetric NC divisions increasing progenitor number, coupled with delayed and initially diminished production of neurons and BPs. RG eventually differentiate in excess number and overproduce neurons and BPs rostrally resulting in tangential expansion of frontal areas and increased laminar thickness. Thus, transient Fgf10 expression regulates timely differentiation of RG, and through this function, determines both length of the early progenitor expansion phase and onset of neurogenesis and ultimately the number of progenitors and neurons fated to specific cortical areas.


Figures

Figure 1
Figure 1. Transient expression of Fgf10 at apical aspect of cortical VZ
Tangential (A, A’), and coronal (B–E, B’–E’) sections from wt brains processed for in situ hybridization using DIG-Fgf10 probes at ages indicated. Boxed areas in A–E are shown at higher magnification in A’–E’. At E9.5 (A, A’), Fgf10 expression is robust in hypothalamus, but is not detectable in dTel, other than very weak expression near rostral midline (arrowhead). Strong Fgf10 expression is detected at apical surface of dTel (arrow in B–D; arrowhead in B’–D’) at E10.0 (B, B’) and E10.5 (C, C’), and is sustained at E11.5 (D, D’), but downregulated to non-detectable by E13.5 (E, arrow; E’, arrowhead). Scale bars: 0.2 mm (A–E), 0.1 mm (A’–E’). dTel: dorsal telencephalon, HT: hypothalamus, Ctx: cortex, GE, ganglionic eminence.
Figure 2
Figure 2. Loss of Fgf10 delays radial glia differentiation
(A–F’) Immunofluorescence staining of wt (wt) (A–F) and Fgf10 −/− (A’–F’) brains at ages indicated with antibodies against radial glia markers, BLBP (A–E’) and GLAST (F, F’). At E11.5 in wt, stronger staining for BLBP and GLAST was detected in medial and ventrolateral cortex (arrowheads in A, F) and moderate staining elsewhere in cortex (arrow). Same staining pattern is evident at E12.5, but overall staining levels are higher (B). By E13.5, staining becomes relatively high throughout cortex, and the radial glia fibers emanating from the pallial-subpallial boundary are particularly intensely labeled (arrow in C). Compared to wt, in the Fgf10 −/− cortex, BLBP staining (A’, B’) and GLAST staining (F’) is substantially diminished. By E13.5, staining is comparable between wt (C) and Fgf10 −/− cortex (C’). Arrowheads and arrows mark same relative positions in Fgf10 −/− cortex (A’–C’) as in wt cortex (A–C). Moderate BLBP staining in mid cortex of wt at E11.5 and E12.5 (arrow in A, B, respectively) is shown at higher magnification in D and E. Diminished BLBP staining in mid cortex of Fgf10 −/− cortex at E11.5 and E12.5 (arrow in A’, B’, respectively) is shown at higher magnification in D’ and E’. Scale bars: 0.5 mm (A, A’), 0.5 mm (B, B’), 0.5 mm(C, C’), 50 µm (D–F’), 0.5 mm (F, F’). Ctx: cortex, GE, ganglionic eminence, VZ ventricular zone, PP: preplate.
Figure 3
Figure 3. Fgf10 promotes radial glia differentiation in vivo
Fgf10 expression construct or empty vector was co-electroporated at E11.5 with an eGFP expression vector to confirm site, and BLBP staining was assessed at E12.5 on coronal sections. (A–C) Sections of E12.5 brains electroporated with empty vector at E11.5, stained with anti-BLBP antibody, exhibit staining similar to non-electroporated wt (not shown) (n=3): eGFP labeling reveals electroporation site; (B) BLBP immunostaining; (C) merged image. (A’–C’) Sections of E12.5 brains electroporated with Fgf10 expression vector at E11.5, stained with anti-BLBP antibody, exhibit enhanced staining compared to empty vector cases (n=4): (A’) eGFP labeling reveals electroporation site; (B’) BLBP immunostaining; (C’) merged image. Higher magnification images of empty vector-transfected cases shown in A–C and Fgf10-transfected cases shown in A’–C’ are shown in D–F and D’–F’, respectively. Scale bars: 0.1 mm (A–C’), 50 µm (D’–F’). VZ, ventricular zone; PP, preplate; SVZ, subventricular zone.
Figure 4
Figure 4. Loss of Fgf10 delays radial glia differentiation preferentially in rostral cortex
(A,A’) BLBP immunostaining of series of coronal sections along rostral-caudal axis of wt (wt) (A) and Fgf10 −/− cortex (A’). (B) Quantification of BLBP staining intensity of wt and Fgf10−/− cortices (n=4); mean ± s.e.m. is plotted at 120 µm intervals along the rostral-caudal cortical axis. BLBP staining is significantly diminished in rostral sections of Fgf10 −/− cortex compared to wt, but staining is comparable in caudal sections (also compare A to A’) (Actual data for each plotted point in B, Rostral to Caudal and signifcanace, unpaired Student’s t-test: wt 24.8 ± 2.3, KO 4.8 1.8, p<0.001; wt 14.8 ± 3.5, 9.9 ± 1.1, p< 0.01; 12.9 ± 1.4, 10.2 ± 3.4, n.s.; 16.7 ± 2.1, 13.8 ± 2.9, n.s.; 8.2 ± 3.4, 7.2 ± 3.0, n.s.) (C) Fluorescence intensity of BLBP staining in rostral cortex at E11.5, E12.5 and E13.5 in wt and Fgf10 −/− mice (n=4, 1.0 ± 0.051 s.e.m. at E11.5,1.0 ± 0.064 s.e.m. at E12.5, 1.0 ± 0.041 s.e.m. at E13.5 for wt, and 0.18 ± 0.038 s.e.m. at E11.5, 0.48 ± 0.028 s.e.m. at E12.5, 0.99 ± 0.09 s.e.m. at E13.5 for Fgf10 −/−, respectively. Significance between wt and Fgf10 −/−mice in unpaired Student’s test is p<0.001 at E11.5, p<0.001 at E12.5, and n.s. at E13.5). The difference in BLBP expression between wt and Fgf10 −/− rostral cortex is substantial at E11.5 and E12.5, but is indistinguishable at E13.5; thus, the delay in upregulation of BLBP expression in Fgf10 −/− cortex is transient. (D–F) Quantification of BLBP positive cells in rostral cortex of wt or Fgf10 −/− littermates. Dissociated cells from E11.5 rostral cortex of wt (D, E, F) or Fgf10 −/− (D’, E’, F’) were immunostained by BLBP antibody (E, E’) and counterstained with DAPI (D, D’). Merged images are shown in F and F’. (G) Total cells of E11.5, E12.5 and E13.5 stained by DAPI and positive cells for BLBP staining were counted, respectively (three independent experiments, 10 fields examined per experiment, 29.7 ± 3.6% s.e.m. at E11.5, 48.8 ± 4.0 % s.e.m. at E12.5, 69.5 ± 2.9 % s.e.m. at E13.5 for wt, 9.7 ± 0.8 % s.e.m. at E11.5, 28.2 ± 1.6 % s.e.m. at E12.5, 64.0 ± 2.3 % s.e.m. at E13.5 for Fgf10 −/−, respectively. Significance between wt and Fgf10−/− mice in unpaired Student’s test is p<0.001 at E11.5, p<0.001 at E12.5, and n.s. at E13.5). Scale bar: 0.5mm (A–E”), 0.1mm (D–F’). Ctx: cortex, GE: ganglionic eminence.
Figure 5
Figure 5. Fgf10 deletion delays onset of cortical neurogenesis with initially diminished neuronal production followed by enhanced production
(A–G) Early neurogenesis in wt and Fgf10 −/− cortex. Sections of wt (A–F) and Fgf10−/− (A’–F’) brains at ages indicated were stained with a preplate and layer 6 marker, Tbr1 antibody (A–E’), or a pan-neuronal marker, TuJ1 (F, F’). At E10.5, a low density of Tbr1+ neurons (arrows) is evident in the preplate (PP) on each section through wt cortex (A), but only one neuron (arrow), or more typically, none are found in each section in Fgf10 −/− cortex (A’). From E10.5 through E13.5, fewer Tbr1+ neurons are evident in Fgf10−/− cortex than in wt (A–E’), with a delay of approximately one and a half to two days in neuronal production; however, by E14.5, more neurons are found in cortical plate (CP) of Fgf10 −/− cortex than wt (E, E’). (F, F’) Tuj1 immunostaining also reveals lower density of preplate neurons in Fgf10 −/− cortex than wt. (G) Quantification of Tbr1+ neurons. (n=4, 0.85 ± 0.16 /0.01mm2 s.e.m. at E11.5, 2.98 ± 0.31/0.01 mm2 s.e.m. at E12.5, 9.78 ± 0.16 /0.01mm2 s.e.m. at E13.5, 42.1 ± 0.47 /0.01mm2 s.e.m. at E14.5, 45.9 ± 1.04 /0.01mm2 s.e.m. at E15.5 for wt, 0.14 ± 0.04 /mm2 s.e.m. at E11.5, 0.57 ± 0.01 mm2 s.e.m. at E12.5, 7.37 ± 0.17 /0.01mm2 s.e.m. at E13.5, 30.5 ± 0.75 /0.01mm2 s.e.m. at E14.5, 52.9 ± 2.1 /0.01mm2 s.e.m. at E15.5 for Fgf10−/−, respectively. Significance between wt and Fgf10−/− mice in unpaired Student’s test is p<0.05 at E10.5, p<0.01 at E11.5, p<0.001 at E12.5, p<0.01 at E13.5, and p<0.05 at E14.5). VZ ventricular zone. Scale bar: 50 µm.
Figure 6
Figure 6. Delayed radial glia differentiation results in greater percentage of progenitors undergoing symmetric division producing two progenitors
(A–B) Cell cycle exit of early cortical progenitors in Fgf10−/− cortex. BrdU was injected into pregnant females at E11.5 and embryos were collected 24 hrs later at E12.5. Sections of E12.5 brains of wt (A) or Fgf10−/− (A’) stained with BrdU antibody (red) and Ki67 antibody (green); examples of double labeled cells (arrows) and cells single labeled with BrdU (arrowheads) are marked. (B) Fewer cells leave cell cycle in Fgf10 −/− cortex than in wt. Percentage exit was calculated by dividing number of cells single labeled by BrdU by total number of cells single labeled by BrdU and double labeled by Ki67 in addition. Abut 34% fewer cells exit the proliferative cell cycle in rostral Fgf10 −/− cortex than wt (n=4, 18.7 ± 1.80% s.e.m. for wt, 12.4 ± 0.86% s.e.m., p<0.05 for −/−), whereas exit in caudal cortex is indistinguishable (B, n=4, 19.9 ± 1.60% s.e.m. for wt, 22.0 ± 1.27% s.e.m. for −/−). Abbreviations: M, meninges; PP, preplate; VZ, ventricular zone. (C–D) Pair-cell analysis of wt and Fgf10−/− cortex in vitro. (C) Output of divisions by cortical progenitors in clonal culture. Rostral halves of cortices from wt or Fgf10 −/− embryos at E12.5 were dissected, dissociated, plated at clonal density, followed for 24 hours in culture, and then immunostained with TuJ1 antibody. Shown are pairs of progeny from progenitor division: phase contrast image, DAPI staining (blue), and TuJ1 staining (green). Examples of three types of progeny pairs are shown: neuronal pairs (N-N, upper panels) generated by terminal symmetric division, progenitor pairs (P-P, middle panels) generated by expansion symmetric division, or neuron-progenitor pairs (N-P, lower panels) generated by asymmetric division. (D) In Fgf10−/− clones, P-P pairs are increased (n= 351, 38.7 ± 2.96% s.e.m. for wt, n= 251, 49.5 ± 5.1 s.e.m. for Fgf10 −/−, from three independent experiments, P<0.05) and P-N pairs are reduced (20.7 ± 0.56% SEM for wt, 11.7 ± 2.1 % s.e.m. for Fgf10 −/−, p<0.01) compared to wt, but N-N pairs are not significantly different (40.6 ± 2.4% s.e.m. for wt, 38.8 ± 4.9 % s.e.m. for Fgf10 −/−). Thus, compared to wt, 35% more progenitors from Fgf10 −/−cortex produce a pair of progenitors by symmetric division (p<0.05), whereas 47% fewer produce a progenitor and a neuron by asymmetric division (p<0.01), with no difference between wt and Fgf10−/− progenitors that produce two neurons by symmetric division (Figure 6D, n=351 pairs for wt, n=251 pairs for Fgf10−/−). Scale bars: 25 µm (A, A’), 20 µm (C). *p<0.05; **p<0.01, compared to wt by unpaired Student’s t test.
Figure 7
Figure 7. Fgf10 −/− cortex has significantly more progenitors in radial column than wild type cortex
Short-pulse BrdU labeling of wt and Fgf10−/− cortex at E14.5. BrdU was injected to pregnant females and E14.5 embryos were collected after 1 hour, and coronal sections through cortex were immunostained with anti-BrdU antibody. (A–B’) More BrdU+ cells are evident in a radial traverse through Fgf10−/− cortex (A’, B’) than in wt (A, B). B and B’ are higher power of boxed areas in A and A’. (C) Counts of BrdU positive cells in a 100 µm wide radial traverse across 20 µm thick sections (n=4, 187 ± 7.9 s.e.m. for wt, 265 ± 15.3 s.e.m. for Fgf10 −/−, unpaired Student’s test, p<0.001 for both). (D, D’) Double immunostaining of E14.5 wt and Fgf10 −/− rostral cortex with Pax6 antibody (red) specific for radial glia and Tbr2 antibody (green) specific for basal progenitors. (E) Counts of Pax6+ cells showing a significant increase in Fgf10 −/− rostral cortex compared to wt (p<0.001). VZ ventricular zone, SVZ subventricular zone, CP: cortical plate. Scale bars: 0.1 mm (A, A’), 20 µm (B, B’), 20 µm (D, D’).
Figure 8
Figure 8. Fgf10 −/− mice exhibit overall increase in cortical surface area and increased laminar thickness preferentially in rostral cortex
(A, B) Dorsal views of P0 brains of wt (A) and Fgf10−/− mice (B). (C) Quantitative comparison of brain size between wt (n=4) and Fgf10 −/− mice (n=4) at P0. Area size: dorsal cortical surface area is 18.6 ± 2.93 % greater in Fgf10 −/− than wt; length from the top of the rostral pole to the caudolateral pole is 7.3% ± 0.88% greater in Fgf10 −/− than wt; length of midline structure across anterior/posterior axis is 32.4 ± 9.45% greater in Fgf10 −/− than wt; number of cells in a 100 µm wide radial traverse in 20 µm thick sections in rostral cortex is 34% ± 4.8% greater in Fgf10 −/− than wt. (D, E) Nissl staining of sagittal sections of P0 brain of wt (D) and Fgf10−/− mice (E). Rostral cortex is significantly thicker in Fgf10 −/− mice than in wt. (F – G’) Higher power views of Nissl stained sections through rostral and caudal cortex of wt and Fgf10 −/− mice. Laminar patterning in Fgf10 −/− cortex resembles wt, but the cellular layers are thicker in Fgf10 −/− rostral cortex compared to wt; no difference is evident between wt and Fgf10 −/− caudal cortex. (H) Quantification of cortical laminar thickness. Measurement were done at five different position as indicated (a to e) of the radial thickness from bottom of the subplate to the pial surface. (I) Percentage increase of cortical radial thickness in Fgf10−/− cortex compared to wt (Student’s test; p<0.001 for position a to d, and p<0.01 for e). Scale bars: 0.5 mm (A. B), 0.5 mm (D, E), 0.1 mm (F–G’).
Figure 9
Figure 9. Frontal areas are preferentially expanded in Fgf10 −/− cortex
(A, A’) Dorsal views of P0 brains of wt (A) or Fgf10−/− (A’) mice processed for whole mount in situ hybridization with DIG-labeled cad8 riboprobes. (B) Quantification of the frontal cad8 expression domain in wt or Fgf10−/− cortex as indicated in drawing. Both absolute and relative areas and lengths, for both overall and Cad8 domain measurements, are increased in the Fgf10 −/− cortex compared to wt: Overall area, 12.0 ± 4.0%, unpaired Student’s t-test, n.s.; Overall length, 6.36 ± 4.8%, n.s.. Cad8 domains: Absolute sizes (64.0 ± 3.1% increase for area, p<0.001; 34.0 ± 3.0% for length, p<0.001), Relative sizes / corrected for overall (36.9 ± 2.6% increase for area, p<0.01; 26.0 ± 2.8% increase for length, p<0.05). (C–E’) In situ hybridization analysis of sagittal sections of P0 wt and Fgf10 −/− brains with cad8, Lmo4, and ephrin-A5, as indicated. Black arrowheads mark the caudal border of the frontal expression domain of cad8 (C,C’) and Lmo4 (D,D’), and the rostral border of the mid-cortex expression domain of ephrin-A5. The gray arrowheads mark the rostral border of the occipital expression domain of cad8 (C,C’) and Lmo4 (D,D’), and the caudal border of the mid-cortex expression domain of ephrin-A5. Scale bars: 0.5mm (A, A’), 0.5 mm (C–D’).

Comment in

Similar articles

Cited by

References

    1. Aaku-Saraste E, Hellwig A, Huttner WB. Loss of Occludin and functional tight junctions, but not ZO-1, during neural tube closure--remodeling of the neuroepithelium prior to neurogenesis. Dev Biol. 1996;180:664–679. - PubMed
    1. Anthony TE, Klein C, Fishell G, Heintz N. Radial glia serve as neuronal progenitors in all regions of the central nervous system. Neuron. 2004;41:881–890. - PubMed
    1. Anthony TE, Mason HA, Gridley T, Fishell G, Heintz N. Brain lipid-binding protein is a direct target of Notch signaling in radial glial cells. Genes Dev. 2005;19:1028–1033. - PMC - PubMed
    1. Bachler M, Neubuser A. Expression of members of the Fgf family and their receptors during midfacial development. Mech Dev. 2001;100:313–316. - PubMed
    1. Bishop KM, Rubenstein JL, O'Leary DD. Distinct actions of Emx1, Emx2, and Pax6 in regulating the specification of areas in the developing neocortex. J Neurosci. 2002;22:7627–7638. - PMC - PubMed

Publication types

MeSH terms

LinkOut - more resources