. 2010 Apr;20(4):558-71.
doi: 10.1002/hipo.20667.

Axonal sodium channel distribution shapes the depolarized action potential threshold of dentate granule neurons

Affiliations

Axonal sodium channel distribution shapes the depolarized action potential threshold of dentate granule neurons

Geraldine J Kress et al. Hippocampus. 2010 Apr.

Abstract

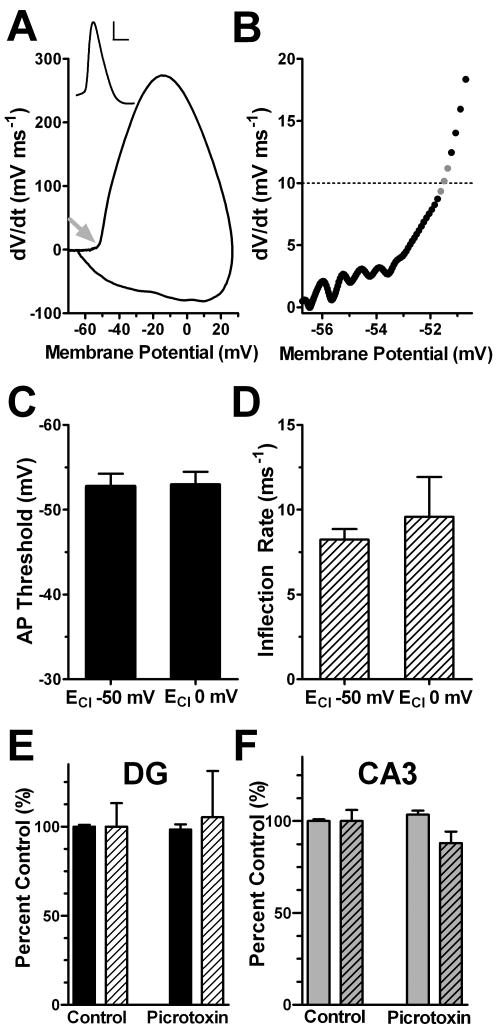
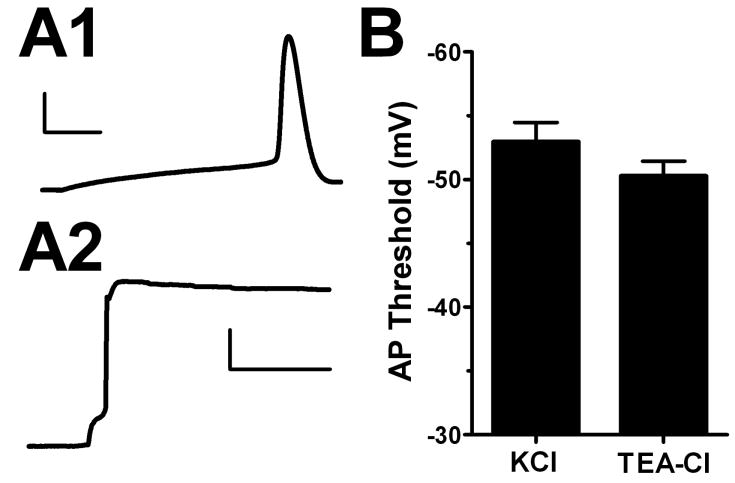
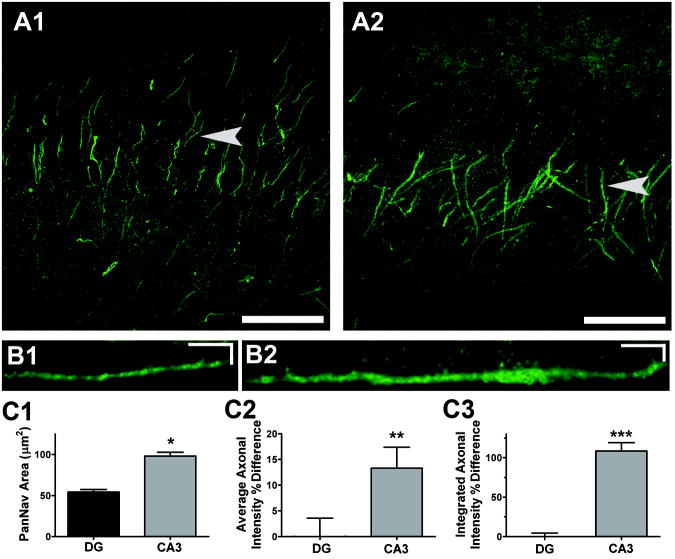
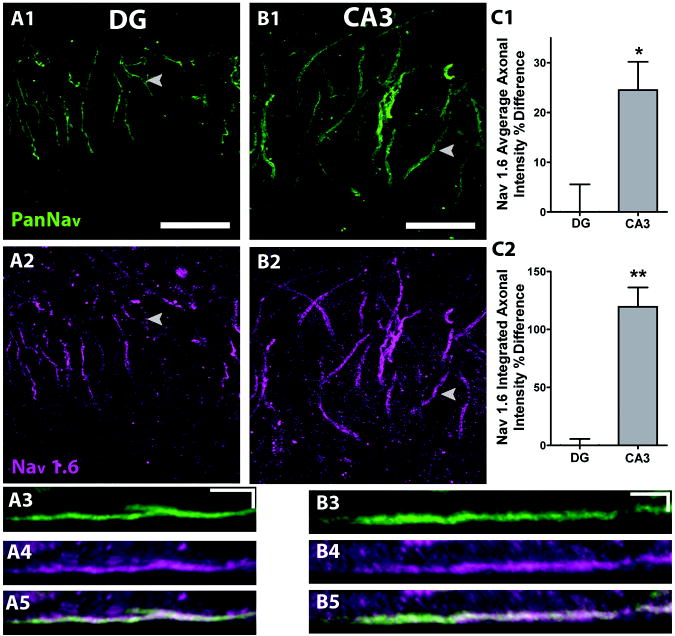
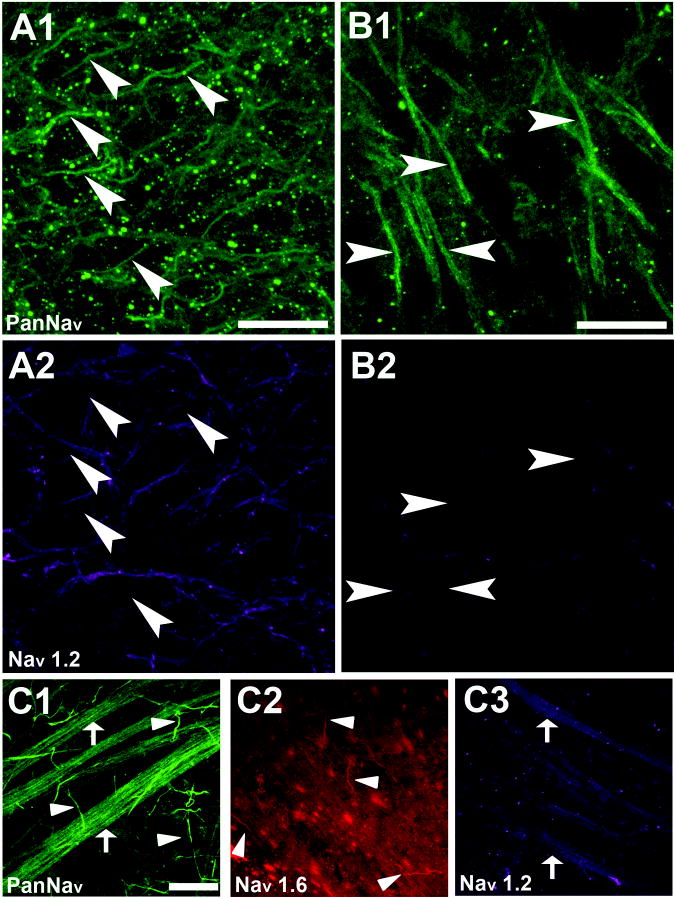
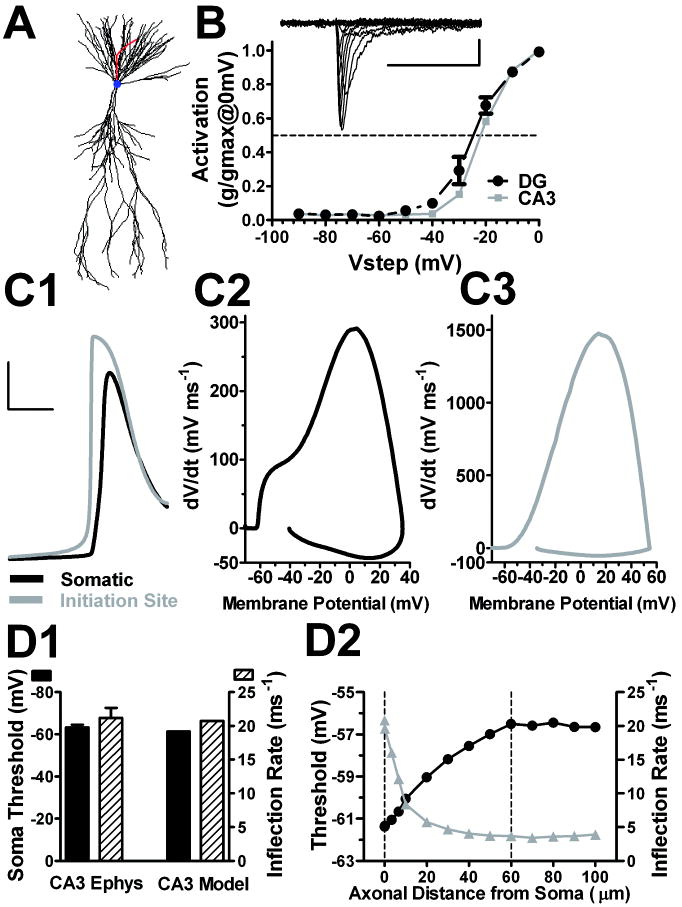
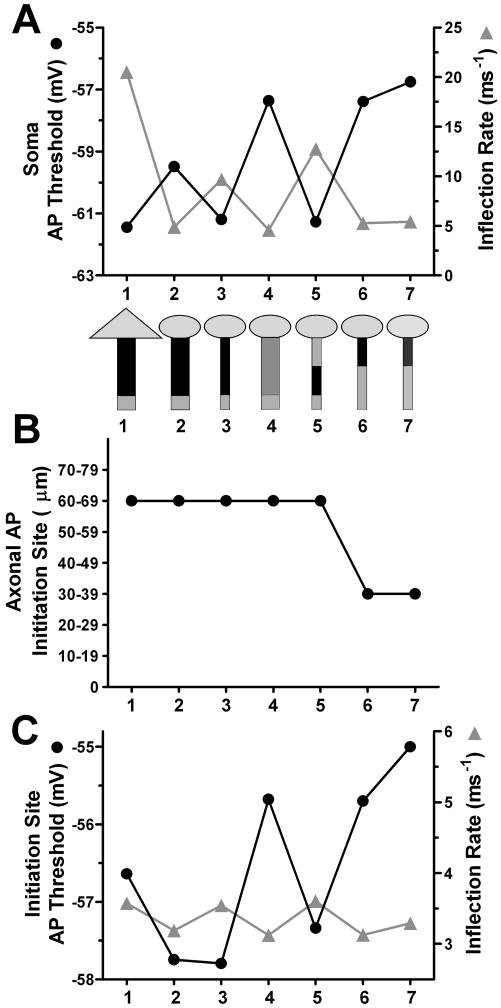
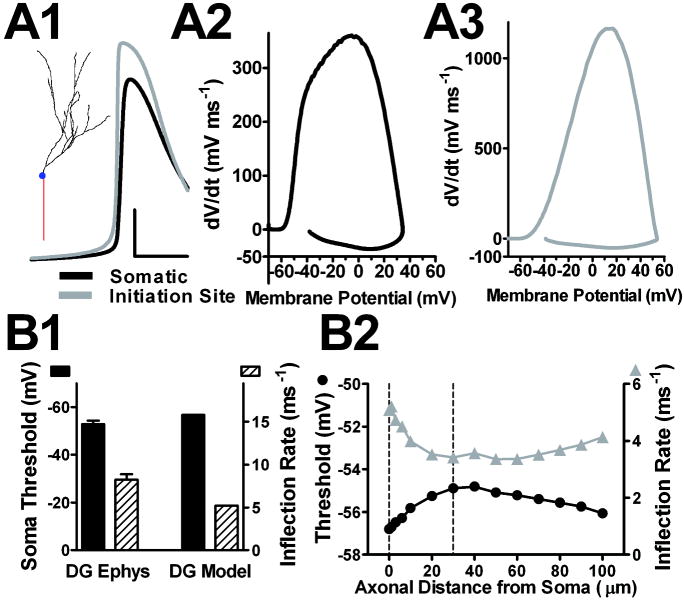
Intrinsic excitability is a key feature dictating neuronal response to synaptic input. Here we investigate the recent observation that dentate granule neurons exhibit a more depolarized voltage threshold for action potential initiation than CA3 pyramidal neurons. We find no evidence that tonic GABA currents, leak or voltage-gated potassium conductances, or the expression of sodium channel isoform differences can explain this depolarized threshold. Axonal initial segment voltage-gated sodium channels, which are dominated by the Na(V)1.6 isoform in both cell types, distribute more proximally and exhibit lower overall density in granule neurons than in CA3 neurons. To test possible contributions of sodium channel distributions to voltage threshold and to test whether morphological differences participate, we performed simulations of dentate granule neurons and of CA3 pyramidal neurons. These simulations revealed that cell morphology and sodium channel distribution combine to yield the characteristic granule neuron action potential upswing and voltage threshold. Proximal axon sodium channel distribution strongly contributes to the higher voltage threshold of dentate granule neurons for two reasons. First, action potential initiation closer to the somatodendritic current sink causes the threshold of the initiating axon compartment to rise. Second, the proximity of the action potential initiation site to the recording site causes somatic recordings to more faithfully reflect the depolarized threshold of the axon than in cells like CA3 neurons, with distally initiating action potentials. Our results suggest that the proximal location of axon sodium channels in dentate granule neurons contributes to the intrinsic excitability differences between DG and CA3 neurons and may participate in the low-pass filtering function of dentate granule neurons.


Figures

Figure 1
Figure 1
Altered intracellular chloride concentration and GABA receptor antagonists do not influence DG action potential voltage threshold or inflection rate. DG action potentials were elicited with a brief (20 ms) minimal current injection in the presence of either a potassium gluconate (ECl -50 mV) or a potassium chloride (ECl 0 mV) internal solution. A. Phase plot, the slope of the somatic membrane potential (dV/dt) versus the somatic membrane potential, of a DG neuron filled with potassium gluconate. The arrow points to the action potential voltage threshold. Inset shows the somatic membrane potential record of an action potential used to generate the phase plot (scale bar 20 mV, 1 ms). The membrane potential and action potential thresholds have been corrected for the liquid junction potentials. B. The membrane potential at which phase plot slope reached 10 mV ms-1 (dashed line) was denoted threshold. The slope of the phase plot at the three data points bracketing spike threshold at 10 mV ms-1 (gray data points) were calculated using linear regression and denoted as an inflection rate (ms-1). Phase plot analysis yields a voltage threshold at -51.49 mV and an inflection rate of 7.25 ms-1. C and D. Neither action potential threshold nor inflection rate was influenced with altered intracellular chloride concentration (n =7-11 p>0.05). (E) and (F) GABA receptor antagonist, picrotoxin (100 μM) does not influence DG (E) or CA3 (F) voltage threshold or inflection rate. Action potentials were elicited with a brief (20 ms) minimal current injection in the presence of either a bath solution or 100 μM picrotoxin (with potassium gluconate pipette solution). Solid bars represent the action potential voltage threshold, while hashed bars represent the inflection rate (n=3-9 p<0.05).
Figure 2
Figure 2
Blocking potassium channels does not change DG voltage threshold. Action potentials were elicited with a brief depolarization from -70 mV with KCl (A1) (scale bar 25 mV, 3 ms) or TEA-Cl (A2) (scale bar 25 mV, 150 ms) intracellular pipette solution. The traces represent different cells. B. Summary. DG action potential (AP) voltage threshold was not significantly changed when potassium channels were blocked (n=6-9 p>0.05).
Figure 3
Figure 3
The CA3 pyramidal axons have a greater area and density of Nav alpha-subunit immunoreactivity than DG axons. A. PanNav immunoreactivity within DG (A1) and CA3 (A2) regions shown by three dimensional confocal reconstructions. Scale bars are 50 μm. B1-2. Stretched side views (created with Metamorph kymograph function), of PanNav staining from a representative DG axon (B1) and CA3 axon (B2) indicated by arrows in A. Scale bars are 5 μm and 5 μm. C1-3. The axonal area (C1), density (C2), and total sum (C3) of PanNav staining on DG (n=32) and CA3 (n=32) axons. Density and total sum are expressed as a percent difference on DG and CA3 axons. *, P<0.00001; **,P<0.02; ***, P<0.0001.
Figure 4
Figure 4
CA3 axons have a greater area and density of Nav1.6 than DG axons. Immunoreactivity for Nav1.6 co-localizes with PanNav on DG (A1-2) and CA3 (B1-2) axons (scale bars 25 μm). A3-5. Kymographs of a representative DG axon for PanNav (A3), Nav1.6 (A4) and overlay (A5) (scale bars 5 μm, 5 μm). B3-5. Kymographs of a representative CA3 axon for PanNav (B3), Nav1.6 (B4) and overlay (B5) (scale bars 5 μm, 5 μm). C1-2. Quantification of the density (C1) and total sum (C2) of Nav1.6 axonal immunoreactivity expressed as a percent difference on DG and CA3 axons. N=22. *, P<0.004;**, P<0.0001.
Figure 5
Figure 5
Immunoreactivity for Nav1.2 does not co-localize with PanNav on DG and CA3 axons but is found on the rat retinal nerve fiber layer. A1-2. DG immunoreactivity for PanNav (A1) and Nav1.2 (A2). Although there is hilar staining with the Nav1.2 antibody, it does not co-localize with the PanNav antibody staining (arrows) and therefore is not associated with DG AIS (scale bar 25 μm). B1-2. CA3 immunoreactivity for PanNav (B1) and Nav1.2 (B2). Again there is no detectable co-localization. C1-C3. Whole-mount rat retina positive control for antibody sensitivity. Immunoreactivity was detected with PanNav (C1) and Nav1.6 (C2) on ganglion cell AIS. Immunoreactivity was detected with Nav1.2 (C3) in the nerve fiber layer (scale bar 25 μm). These patterns are as previously published (Boiko et al., 2003; Van Wart and Matthews, 2006; Van Wart et al., 2007).
Figure 6
Figure 6
Action potential properties of a CA3 multi-compartment model. A. CA3 reconstruction was imported into NEURON, resulting in 821 segments (morphology adapted from (Ishizuka et al., 1990); compartment model from (Lazarewicz et al., 2002)) with an axon added based on our previous measurements (Kress et al., 2008), of an AIS initial diameter of 2.5 μm that tapered to a final diameter of 1 μm. The axonal Nav distribution was based on previous immunohistochemistry measures from our lab with Nav distribution extending to the distal axon 80 μm from the soma (Meeks and Mennerick, 2007). Somatic and dendritic channel distributions were from existing models (Lazarewicz et al., 2002). B. Conductance/voltage profile of Nav currents in nucleated patches from DG (black circles) and CA3 neurons (gray squares) (n = 5). The inset shows sample traces evoked in a DG patch by voltage pulses from -90 mV to +30 mV, the protocol used to generate the summary. Somatic and axonal Nav biophysical properties were consistent with this activation profile, with a half-activation voltage of -30 mV. C1-C3. Somatic (black) and AIS (gray) action potentials (C1) with their corresponding phase plots (C2-3). The action potential was elicited with a just-suprathreshold current injection of approximately 134 pA. Calibration bars for the action potential traces are 25 mV and 2 ms. D1. CA3 model action potential threshold and inflection rate were similar to experimentally derived CA3 neuron responses (n = 9 CA3 pyramidal neurons)(Kress et al., 2008). D2. CA3 model action potential voltage threshold and inflection rate as a function of the axonal distance from soma. Dashed line at 60 μm is the site of action potential initiation; dashed line at 0 μm is the soma compartment.
Figure 7
Figure 7
Constructing a model with DG action potential characteristics from the CA3 model. A1. Cartoons depict the sequential changes made to the CA3 model (simulation #1) to produce a simulated DG neuron and to test contributions to the depolarized threshold and altered action potential shape. Triangle depicts the CA3 soma, circle represents DG soma. The rectangle represents a 100 μm long axon, with either a CA3-like initial diameter (2.5 μm) and AIS taper (taper not represented) or a DG-like diameter (1.4 μm) and AIS taper. Gray shading represents both the location and relative density of Nav channels. Simulation #7 includes a cell-wide decrease in channel density of 20% to match experimental observations and to simulate experimentally observed phase plot shape. The constellation of channels and the channel densities were the same among all simulations, except for the indicated changes in Nav location and density. The graph shows the somatic action potential threshold (filled circles, solid line) and inflection rate (gray triangles and line) with model modifications. Numbers indicate simulation number for reference. B. The axonal initiation site (first to peak) from the indicated simulations. C. Initiation site action potential voltage threshold and inflection rate corresponding to the indicated simulations. The model most fully recapitulating DG action potential characteristics is simulation #7.
Figure 8
Figure 8
Detailed action potential properties of a DG multi-compartment model. The DG model shown here in detail is Figure 7, simulation #7. A1. The inset shows the DG morphology adapted from Schmidt-Hieber et al., 2007, resulting in 253 segments. The trace is the simulated action potential waveform generated with a just-suprathreshold current injection (35 pA). The initiation site action potential precedes the somatic action potential and has a shallower inflection rate. Calibration: 25 mV and 2 ms A2. The model DG somatic phase plot resembled the experimentally obtained DG somatic phase plot (Figure 1A), with similar maximum dV/dt values. A3. Initiation site phase plot. The initiation site was 30 μm from the soma. B1. DG model action potential voltage threshold and inflection rate are similar to the experimentally derived (DG Ephys) DG neuron responses (n = 11 DG neurons)(Kress et al., 2008). B2. DG model action potential voltage threshold and inflection rate axonal compartments of varying distance from soma. Dotted line at 30 μm indicates the site of action potential initiation; dotted line at 0 μm represents soma.

Similar articles

Cited by

References

    1. Bean BP. The action potential in mammalian central neurons. Nat Rev Neurosci. 2007;8(6):451–65. - PubMed
    1. Bekkers JM, Delaney AJ. Modulation of excitability by alpha-dendrotoxin-sensitive potassium channels in neocortical pyramidal neurons. J Neurosci. 2001;21(17):6553–60. - PMC - PubMed
    1. Boiko T, Van Wart A, Caldwell JH, Levinson SR, Trimmer JS, Matthews G. Functional specialization of the axon initial segment by isoform-specific sodium channel targeting. J Neurosci. 2003;23(6):2306–13. - PMC - PubMed
    1. Caraiscos VB, Elliott EM, You-Ten KE, Cheng VY, Belelli D, Newell JG, Jackson MF, Lambert JJ, Rosahl TW, Wafford KA. Tonic inhibition in mouse hippocampal CA1 pyramidal neurons is mediated by a5 subunit-containing g-aminobutyric acid type A receptors. Proc Natl Acad Sci U S A. 2004;101(10):3662–7. and others. - PMC - PubMed
    1. Chen Y, Yu FH, Sharp EM, Beacham D, Scheuer T, Catterall WA. Functional properties and differential neuromodulation of Nav1.6 channels. Mol Cell Neurosci. 2008;38(4):607–15. - PMC - PubMed

Publication types

Substances