Independent effects of intra- and extracellular Abeta on learning-related gene expression
- PMID: 19556514
- PMCID: PMC2708813
- DOI: 10.2353/ajpath.2009.090044
Independent effects of intra- and extracellular Abeta on learning-related gene expression
Abstract
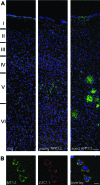
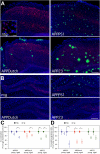
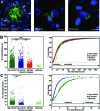
Alzheimer's disease is characterized by numerous pathological abnormalities, including amyloid beta (Abeta) deposition in the brain parenchyma and vasculature. In addition, intracellular Abeta accumulation may affect neuronal viability and function. In this study, we evaluated the effects of different forms of Abeta on cognitive decline by analyzing the behavioral induction of the learning-related gene Arc/Arg3.1 in three different transgenic mouse models of cerebral amyloidosis (APPPS1, APPDutch, and APP23). Following a controlled spatial exploration paradigm, reductions in both the number of Arc-activated neurons and the levels of Arc mRNA were seen in the neocortices of depositing mice from all transgenic lines (deficits ranging from 14 to 26%), indicating an impairment in neuronal encoding and network activation. Young APPDutch and APP23 mice exhibited intracellular, granular Abeta staining that was most prominent in the large pyramidal cells of cortical layer V; these animals also had reductions in levels of Arc. In the dentate gyrus, striking reductions (up to 58% in aged APPPS1 mice) in the number of Arc-activated cells were found. Single-cell analyses revealed both the proximity to fibrillar amyloid in aged mice, and the transient presence of intracellular granular Abeta in young mice, as independent factors that contribute to reduced Arc levels. These results provide evidence that two independent Abeta pathologies converge in their impact on cognitive function in Alzheimer's disease.
Figures


Similar articles
-
The type of Aβ-related neuronal degeneration differs between amyloid precursor protein (APP23) and amyloid β-peptide (APP48) transgenic mice.Acta Neuropathol Commun. 2013 Nov 18;1(1):77. doi: 10.1186/2051-5960-1-77. Acta Neuropathol Commun. 2013. PMID: 24252227 Free PMC article.
-
Endogenous murine Aβ increases amyloid deposition in APP23 but not in APPPS1 transgenic mice.Neurobiol Aging. 2015 Jul;36(7):2241-2247. doi: 10.1016/j.neurobiolaging.2015.03.011. Epub 2015 Mar 25. Neurobiol Aging. 2015. PMID: 25911278 Free PMC article.
-
Environmental enrichment lessens cognitive decline in APP23 mice without affecting brain sirtuin expression.J Alzheimers Dis. 2014;42(3):851-64. doi: 10.3233/JAD-131430. J Alzheimers Dis. 2014. PMID: 24961946
-
Spatial Memory Impairment is Associated with Intraneural Amyloid-β Immunoreactivity and Dysfunctional Arc Expression in the Hippocampal-CA3 Region of a Transgenic Mouse Model of Alzheimer's Disease.J Alzheimers Dis. 2016;51(1):69-79. doi: 10.3233/JAD-150975. J Alzheimers Dis. 2016. PMID: 26836189
-
Fibrillar Aβ triggers microglial proteome alterations and dysfunction in Alzheimer mouse models.Elife. 2020 Jun 8;9:e54083. doi: 10.7554/eLife.54083. Elife. 2020. PMID: 32510331 Free PMC article.
Cited by
-
Orchestrated experience-driven Arc responses are disrupted in a mouse model of Alzheimer's disease.Nat Neurosci. 2012 Oct;15(10):1422-9. doi: 10.1038/nn.3199. Epub 2012 Aug 26. Nat Neurosci. 2012. PMID: 22922786 Free PMC article.
-
Synaptic plasticity defect following visual deprivation in Alzheimer's disease model transgenic mice.J Neurosci. 2012 Jun 6;32(23):8004-11. doi: 10.1523/JNEUROSCI.5369-11.2012. J Neurosci. 2012. PMID: 22674275 Free PMC article.
-
Impairment of visual cortical plasticity by amyloid-beta species.Neurobiol Dis. 2021 Jul;154:105344. doi: 10.1016/j.nbd.2021.105344. Epub 2021 Mar 22. Neurobiol Dis. 2021. PMID: 33766652 Free PMC article.
-
Early-life stress elicits peripheral and brain immune activation differently in wild type and 5xFAD mice in a sex-specific manner.J Neuroinflammation. 2022 Jun 15;19(1):151. doi: 10.1186/s12974-022-02515-w. J Neuroinflammation. 2022. PMID: 35705972 Free PMC article.
-
Neuron Loss in Alzheimer's Disease: Translation in Transgenic Mouse Models.Int J Mol Sci. 2020 Oct 30;21(21):8144. doi: 10.3390/ijms21218144. Int J Mol Sci. 2020. PMID: 33143374 Free PMC article. Review.
References
-
- Arriagada PV, Growdon JH, Hedley-Whyte ET, Hyman BT. Neurofibrillary tangles but not senile plaques parallel duration and severity of Alzheimer’s disease. Neurology. 1992;42:631–639. - PubMed
-
- Ingelsson M, Fukumoto H, Newell KL, Growdon JH, Hedley-Whyte ET, Frosch MP, Albert MS, Hyman BT, Irizarry MC. Early Abeta accumulation and progressive synaptic loss, gliosis, and tangle formation in AD brain. Neurology. 2004;62:925–931. - PubMed
-
- Tsai J, Grutzendler J, Duff K, Gan WB. Fibrillar amyloid deposition leads to local synaptic abnormalities and breakage of neuronal branches. Nat Neurosci. 2004;7:1181–1183. - PubMed
Publication types
MeSH terms
Substances
LinkOut - more resources
Full Text Sources
Medical
Molecular Biology Databases

