. 2009 Sep;83(17):8946-56.
doi: 10.1128/JVI.01857-08. Epub 2009 Jun 24.

Toll-like receptor 4 deficiency increases disease and mortality after mouse hepatitis virus type 1 infection of susceptible C3H mice

Affiliations

Toll-like receptor 4 deficiency increases disease and mortality after mouse hepatitis virus type 1 infection of susceptible C3H mice

Aaruni Khanolkar et al. J Virol. 2009 Sep.

Abstract

Severe acute respiratory syndrome (SARS) is characterized by substantial acute pulmonary inflammation with a high mortality rate. Despite the identification of SARS coronavirus (SARS-CoV) as the etiologic agent of SARS, a thorough understanding of the underlying disease pathogenesis has been hampered by the lack of a suitable animal model that recapitulates the human disease. Intranasal (i.n.) infection of A/J mice with the CoV mouse hepatitis virus strain 1 (MHV-1) induces an acute respiratory disease with a high lethality rate that shares several pathological similarities with SARS-CoV infection in humans. In this study, we examined virus replication and the character of pulmonary inflammation induced by MHV-1 infection in susceptible (A/J, C3H/HeJ, and BALB/c) and resistant (C57BL/6) strains of mice. Virus replication and distribution did not correlate with the relative susceptibilities of A/J, BALB/c, C3H/HeJ, and C57BL/6 mice. In order to further define the role of the host genetic background in influencing susceptibility to MHV-1-induced disease, we examined 14 different inbred mouse strains. BALB.B and BALB/c mice exhibited MHV-1-induced weight loss, whereas all other strains of H-2(b) and H-2(d) mice did not show any signs of disease following MHV-1 infection. H-2(k) mice demonstrated moderate susceptibility, with C3H/HeJ mice exhibiting the most severe disease. C3H/HeJ mice harbor a natural mutation in the gene that encodes Toll-like receptor 4 (TLR4) that disrupts TLR4 signaling. C3H/HeJ mice exhibit enhanced morbidity and mortality following i.n. MHV-1 infection compared to wild-type C3H/HeN mice. Our results indicate that TLR4 plays an important role in respiratory CoV pathogenesis.


Figures
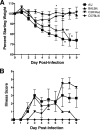
FIG. 1.
FIG. 1.
MHV-1-induced weight loss and systemic disease. (A) A/J, BALB/c, C3H/HeJ, and C57BL/6 mice were infected i.n. with MHV-1, and their weights were monitored daily. The results are depicted as the mean percentage of the starting weight (n = 4 mice per group). The error bars indicate the standard errors of the mean (SEM). The experiment was performed twice with similar results. Each plus represents the loss of an individual mouse on the indicated day. *, P < 0.05 for A/J versus BALB/c and C57BL/6 mice as determined by ANOVA. (B) The mice shown in panel A were observed daily and assigned a clinical illness score as described in Materials and Methods. The results are expressed as the mean illness score (n = 4 mice per group). The error bars indicate the SEM.
FIG. 2.
FIG. 2.
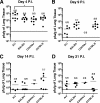
Kinetics of MHV-1 replication in the lungs. The data represent the PFU/g of lung tissue for individual mice of the indicated strains at days 4 (A), 9 (B), 14 (C), and 21 (D) p.i. with MHV-1. The mean of each group is indicated by a short horizontal line. The fractions represent the number of surviving mice over the number of initial mice for each strain at each time point. The limit of detection at each time point is indicated by the long horizontal line. Combined data from two independent experiments are shown (n = 7 to 8 mice per group). *, P < 0.05 for A/J versus C3H/HeJ mice as determined by ANOVA.
FIG. 3.
FIG. 3.
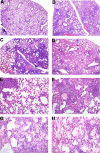
Hematoxylin and eosin staining of lung sections. Whole lungs from C57BL/6 (A and E), BALB/c (B and F), A/J (C and G), and C3H/HeJ (D and H) mice were harvested at day 9 p.i. with MHV-1. The lungs were fixed in 10% neutral buffered formalin, embedded in paraffin, and sectioned prior to being stained with hematoxylin and eosin. Final magnification, ×40 (A to D) and ×200 (E to H). The images are representative of lung sections obtained from two separate experiments (n = 5 to 8 mice per group).
FIG. 4.
FIG. 4.
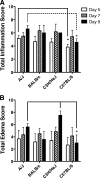
Pulmonary inflammation. Whole lungs were harvested at day 5, day 7, and day 9 after MHV-1 infection for each of the indicated mouse strains. The lungs were fixed in 10% neutral buffered formalin, embedded in paraffin, and sectioned prior to being stained with hematoxylin and eosin. The slides were scored for total inflammation (A) and total edema (B) according to the scales described in Materials and Methods. The results from two combined experiments are expressed as the mean of a total five to eight mice per group. The error bars indicate the standard deviations. *, P < 0.05 as determined by ANOVA for the comparisons indicated.
FIG. 5.
FIG. 5.
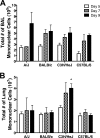
Tempo of pulmonary inflammation. BAL fluid and lung cells were harvested on day 5, day 7, and day 9 after MHV-1 infection for each of the indicated mouse strains. Total mononuclear cells in the BAL fluid (A) and lung (B) were counted using a hemocytometer. The results are expressed as the mean of four mice per group. The error bars indicate the standard deviations. The experiment was performed twice with similar results. *, P < 0.05 for day 9 C3H/HeJ mice versus day 9 A/J, day 9 BALB/c, and day 9 C57BL/6 mice as determined by ANOVA.
FIG. 6.
FIG. 6.
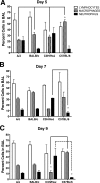
Character of the pulmonary inflammation. BAL was performed at day 5 (A), 7 (B), or 9 (C) after MHV-1 infection. BAL fluid cells were cytospun and subsequently stained with Diff-Quik. The percentages of lymphocytes, macrophages, and neutrophils were determined from counts obtained under a light microscope. No eosinophils were observed in any of the mice. The results are expressed as the mean of four mice per group. The error bars indicate the standard deviations. The experiment was performed twice with similar results. *, P < 0.05 as determined by ANOVA for the comparisons indicated.
FIG. 7.
FIG. 7.
MHV-1-induced alterations in airway function. Penh was determined by whole-body plethysmography and assessed daily after i.n. MHV-1 infection of A/J, BALB/c, C3H/HeJ, and C57BL/6 mice. The results are expressed as the mean baseline Penh for three or four mice per group. The error bars indicate the standard errors of the mean. The experiment was performed twice with similar results. *, P < 0.05 for A/J versus BALB/c and C57BL/6 mice as determined by ANOVA.
FIG. 8.
FIG. 8.
MHV-1-induced weight loss in congenic strains of mice. H-2b C57BL/6 and BALB.B10 (A); H-2d BALB/c, B10.D2, DBA/2J, and NZB/BINJ (B); and H-2d/k A/J and H-2k BALB.K, CBA/J, and B10.BR (C) mice were infected i.n. with MHV-1, and their weights were monitored daily. Each plus represents the loss of an individual mouse on the indicated day. The results are expressed as the mean percentage of the starting weight for three or four mice per group. The error bars indicate the standard deviations. The experiment was performed twice with similar results.
FIG. 9.
FIG. 9.
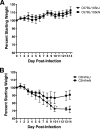
TLR4 deficiency enhances the susceptibility of C3H mice to MHV-1-induced weight loss. H-2b C57BL/10SnJ and C57BL/10ScNCr (A) and H-2k C3H/HeJCr and C3H/HeNCr (B) mice were infected i.n. with MHV-1, and their weights were monitored daily. Weight loss was not recorded on days 11 and 12 in panel B. Each plus represents the loss of an individual mouse on the indicated day. The results are expressed as the mean percentage of the starting weight for four mice per group. The error bars indicate the standard deviations. The experiment was performed twice with similar results.
FIG. 10.
FIG. 10.
TLR4 deficiency enhances susceptibility to MHV-1-induced mortality. Wild-type C3H/HeN and TLR4-deficient C3H/HeJ mice were monitored daily after i.n. MHV-1 infection. The cumulative results from six separate experiments representing 25 C3H/HeN mice and 22 C3H/HeJ mice are shown. The data are plotted as a Kaplan-Meier survival curve. *, P < 0.0001 for C3H/HeN versus C3H/HeJ as determined by a Mantel-Cox log rank test.
FIG. 11.
FIG. 11.
Improved airway function in TLR4-deficient mice following acute MHV-1 infection. Wild-type C3H/HeN and TLR4-deficient C3H/HeJ mice were infected i.n. with MHV-1. The mice were monitored daily by whole-body plethysmography. Each plus represents the loss of an individual mouse on the indicated day. The results are expressed as the mean baseline Penh for four mice per group. The error bars indicate the standard errors of the mean. The experiment was performed twice with similar results. *, P < 0.05 for C3H/HeN versus C3H/HeJ mice as determined by Student's t test.
FIG. 12.
FIG. 12.
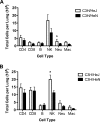
Effect of TLR4 deficiency on MHV-1-induced pulmonary infiltrates. Wild-type C3H/HeN and TLR4-deficient C3H/HeJ mice were infected i.n. with MHV-1. Lung mononuclear cells were harvested on day 5 (A) and day 7 (B) after MHV-1 infection for each of the indicated strains. The results are expressed as the mean total number of the indicated cell type per lung for seven mice per group on day 5 and eight mice per group on day 7. The error bars indicate the standard errors of the mean. The experiment was performed twice with similar results. *, P < 0.05 for C3H/HeN versus C3H/HeJ mice as determined by Student's t test.
FIG. 13.
FIG. 13.
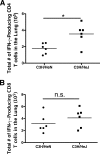
Increased CD4 T-cell responses in TLR4-deficient mice following acute MHV-1 infection. Lung mononuclear cells were harvested from wild-type C3H/HeN and TLR4-deficient C3H/HeJ mice on day 7 after MHV-1 infection. The cells were stimulated with phorbol myristate acetate and ionomycin for 5 h in the presence of brefeldin A prior to being fixed, permeabilized, and stained for CD4, CD8, and IFN-γ. The total numbers of IFN-γ-producing CD4 (A) and CD8 (B) T cells within the lung for each individual are shown. The results represent two combined experiments with six mice per group. The horizontal line indicates the mean. *, P < 0.05 as determined by Student's t test. n.s., not significantly different (P > 0.05).

Similar articles

Cited by

References

    1. Anonymous. 2003. A multicentre collaboration to investigate the cause of severe acute respiratory syndrome. Lancet 3611730-1733. - PMC - PubMed
    1. De Albuquerque, N., E. Baig, X. Ma, J. Zhang, W. He, A. Rowe, M. Habal, M. Liu, I. Shalev, G. P. Downey, R. Gorczynski, J. Butany, J. Leibowitz, S. R. Weiss, I. D. McGilvray, M. J. Phillips, E. N. Fish, and G. A. Levy. 2006. Murine hepatitis virus strain 1 produces a clinically relevant model of severe acute respiratory syndrome in a/j mice. J. Virol. 8010382-10394. - PMC - PubMed
    1. Ding, Y., H. Wang, H. Shen, Z. Li, J. Geng, H. Han, J. Cai, X. Li, W. Kang, D. Weng, Y. Lu, D. Wu, L. He, and K. Yao. 2003. The clinical pathology of severe acute respiratory syndrome (SARS): a report from China. J. Pathol. 200282-289. - PMC - PubMed
    1. Duniho, S. M., J. Martin, J. S. Forster, M. B. Cascio, T. S. Moran, L. B. Carpin, and A. M. Sciuto. 2002. Acute changes in lung histopathology and bronchoalveolar lavage parameters in mice exposed to the choking agent gas phosgene. Toxicol. Pathol. 30339-349. - PubMed
    1. Ely, K. H., A. D. Roberts, J. E. Kohlmeier, M. A. Blackman, and D. L. Woodland. 2007. Aging and CD8+ T cell immunity to respiratory virus infections. Exp. Gerontol. 42427-431. - PMC - PubMed

Publication types

LinkOut - more resources