HIV reservoir size and persistence are driven by T cell survival and homeostatic proliferation
- PMID: 19543283
- PMCID: PMC2859814
- DOI: 10.1038/nm.1972
HIV reservoir size and persistence are driven by T cell survival and homeostatic proliferation
Abstract
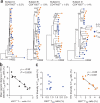
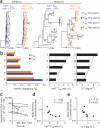
HIV persists in a reservoir of latently infected CD4(+) T cells in individuals treated with highly active antiretroviral therapy (HAART). Here we identify central memory (T(CM)) and transitional memory (T(TM)) CD4(+) T cells as the major cellular reservoirs for HIV and find that viral persistence is ensured by two different mechanisms. HIV primarily persists in T(CM) cells in subjects showing reconstitution of the CD4(+) compartment upon HAART. This reservoir is maintained through T cell survival and low-level antigen-driven proliferation and is slowly depleted with time. In contrast, proviral DNA is preferentially detected in T(TM) cells from aviremic individuals with low CD4(+) counts and higher amounts of interleukin-7-mediated homeostatic proliferation, a mechanism that ensures the persistence of these cells. Our results suggest that viral eradication might be achieved through the combined use of strategic interventions targeting viral replication and, as in cancer, drugs that interfere with the self renewal and persistence of proliferating memory T cells.
Figures


Similar articles
-
Reservoirs for HIV-1: mechanisms for viral persistence in the presence of antiviral immune responses and antiretroviral therapy.Annu Rev Immunol. 2000;18:665-708. doi: 10.1146/annurev.immunol.18.1.665. Annu Rev Immunol. 2000. PMID: 10837072 Review.
-
Th1/17 Polarization of CD4 T Cells Supports HIV-1 Persistence during Antiretroviral Therapy.J Virol. 2015 Nov;89(22):11284-93. doi: 10.1128/JVI.01595-15. Epub 2015 Sep 2. J Virol. 2015. PMID: 26339043 Free PMC article.
-
Antibody-Mediated CD4 Depletion Induces Homeostatic CD4+ T Cell Proliferation without Detectable Virus Reactivation in Antiretroviral Therapy-Treated Simian Immunodeficiency Virus-Infected Macaques.J Virol. 2018 Oct 29;92(22):e01235-18. doi: 10.1128/JVI.01235-18. Print 2018 Nov 15. J Virol. 2018. PMID: 30185596 Free PMC article.
-
Persistence of wild-type virus and lack of temporal structure in the latent reservoir for human immunodeficiency virus type 1 in pediatric patients with extensive antiretroviral exposure.J Virol. 2002 Sep;76(18):9481-92. doi: 10.1128/jvi.76.18.9481-9492.2002. J Virol. 2002. PMID: 12186930 Free PMC article.
-
The challenge of viral reservoirs in HIV-1 infection.Annu Rev Med. 2002;53:557-93. doi: 10.1146/annurev.med.53.082901.104024. Annu Rev Med. 2002. PMID: 11818490 Review.
Cited by
-
Rapid biphasic decay of intact and defective HIV DNA reservoir during acute treated HIV disease.Nat Commun. 2024 Nov 18;15(1):9966. doi: 10.1038/s41467-024-54116-1. Nat Commun. 2024. PMID: 39557853 Free PMC article.
-
The role of Nef in the long-term persistence of the replication-competent HIV reservoir in South African women.bioRxiv [Preprint]. 2024 Nov 3:2024.11.01.621615. doi: 10.1101/2024.11.01.621615. bioRxiv. 2024. PMID: 39554110 Free PMC article. Preprint.
-
From Gut to Blood: Redistribution of Zonulin in People Living with HIV.Biomedicines. 2024 Oct 11;12(10):2316. doi: 10.3390/biomedicines12102316. Biomedicines. 2024. PMID: 39457626 Free PMC article.
-
Isotretinoin promotes elimination of translation-competent HIV latent reservoirs in CD4T cells.PLoS Pathog. 2024 Oct 14;20(10):e1012601. doi: 10.1371/journal.ppat.1012601. eCollection 2024 Oct. PLoS Pathog. 2024. PMID: 39401241 Free PMC article.
-
Sustained antiviral response against in vitro HIV-1 infection in peripheral blood mononuclear cells from people with chronic myeloid leukemia treated with ponatinib.Front Pharmacol. 2024 Sep 23;15:1426974. doi: 10.3389/fphar.2024.1426974. eCollection 2024. Front Pharmacol. 2024. PMID: 39380908 Free PMC article.
References
-
- Palella FJ, Jr., et al. Declining morbidity and mortality among patients with advanced human immunodeficiency virus infection. HIV Outpatient Study Investigators. N. Engl. J. Med. 1998;338:853–860. - PubMed
-
- Finzi D, et al. Identification of a reservoir for HIV-1 in patients on highly active antiretroviral therapy. Science. 1997;278:1295–1300. - PubMed
-
- Chun TW, et al. Quantification of latent tissue reservoirs and total body viral load in HIV-1 infection. Nature. 1997;387:183–188. - PubMed
-
- Finzi D, et al. Latent infection of CD4+ T cells provides a mechanism for lifelong persistence of HIV-1, even in patients on effective combination therapy. Nat. Med. 1999;5:512–517. - PubMed
Publication types
MeSH terms
Substances
Associated data
- Actions
- Actions
- Actions
- Actions
- Actions
- Actions
- Actions
- Actions
- Actions
- Actions
- Actions
- Actions
- Actions
- Actions
- Actions
- Actions
- Actions
- Actions
- Actions
- Actions
- Actions
- Actions
- Actions
- Actions
- Actions
- Actions
- Actions
- Actions
- Actions
- Actions
- Actions
- Actions
- Actions
- Actions
- Actions
- Actions
- Actions
- Actions
- Actions
- Actions
- Actions
- Actions
- Actions
- Actions
- Actions
- Actions
- Actions
- Actions
- Actions
- Actions
- Actions
- Actions
- Actions
- Actions
- Actions
- Actions
- Actions
- Actions
- Actions
- Actions
- Actions
- Actions
- Actions
- Actions
- Actions
- Actions
- Actions
- Actions
- Actions
- Actions
- Actions
- Actions
- Actions
- Actions
- Actions
- Actions
- Actions
- Actions
- Actions
- Actions
- Actions
- Actions
- Actions
- Actions
- Actions
- Actions
- Actions
- Actions
- Actions
- Actions
- Actions
- Actions
- Actions
- Actions
- Actions
- Actions
- Actions
- Actions
- Actions
- Actions
- Actions
- Actions
- Actions
- Actions
- Actions
- Actions
- Actions
- Actions
- Actions
- Actions
- Actions
- Actions
- Actions
- Actions
- Actions
- Actions
- Actions
- Actions
- Actions
- Actions
- Actions
- Actions
- Actions
- Actions
- Actions
- Actions
- Actions
- Actions
- Actions
- Actions
- Actions
- Actions
- Actions
- Actions
- Actions
- Actions
- Actions
- Actions
- Actions
- Actions
- Actions
- Actions
- Actions
- Actions
- Actions
- Actions
- Actions
- Actions
- Actions
- Actions
- Actions
- Actions
- Actions
- Actions
- Actions
- Actions
- Actions
- Actions
- Actions
- Actions
- Actions
- Actions
- Actions
- Actions
- Actions
- Actions
- Actions
- Actions
- Actions
- Actions
- Actions
- Actions
- Actions
- Actions
- Actions
- Actions
- Actions
- Actions
- Actions
- Actions
- Actions
- Actions
- Actions
- Actions
- Actions
- Actions
- Actions
- Actions
- Actions
- Actions
- Actions
- Actions
- Actions
- Actions
- Actions
- Actions
- Actions
- Actions
- Actions
- Actions
- Actions
- Actions
- Actions
- Actions
- Actions
- Actions
- Actions
- Actions
- Actions
- Actions
- Actions
- Actions
- Actions
- Actions
- Actions
- Actions
- Actions
- Actions
- Actions
- Actions
- Actions
- Actions
- Actions
- Actions
- Actions
- Actions
- Actions
- Actions
- Actions
- Actions
- Actions
- Actions
- Actions
- Actions
- Actions
- Actions
- Actions
- Actions
- Actions
- Actions
- Actions
- Actions
- Actions
- Actions
- Actions
- Actions
- Actions
- Actions
- Actions
- Actions
- Actions
- Actions
- Actions
- Actions
- Actions
- Actions
- Actions
- Actions
- Actions
- Actions
- Actions
- Actions
- Actions
- Actions
- Actions
- Actions
- Actions
- Actions
- Actions
- Actions
- Actions
- Actions
- Actions
- Actions
- Actions
- Actions
- Actions
- Actions
- Actions
- Actions
- Actions
- Actions
- Actions
- Actions
- Actions
- Actions
- Actions
- Actions
- Actions
- Actions
- Actions
- Actions
- Actions
- Actions
- Actions
- Actions
- Actions
- Actions
- Actions
- Actions
- Actions
- Actions
- Actions
- Actions
- Actions
- Actions
- Actions
- Actions
- Actions
- Actions
- Actions
- Actions
- Actions
- Actions
- Actions
- Actions
- Actions
- Actions
- Actions
- Actions
- Actions
- Actions
- Actions
- Actions
- Actions
- Actions
- Actions
- Actions
- Actions
- Actions
- Actions
- Actions
- Actions
- Actions
- Actions
- Actions
- Actions
- Actions
- Actions
- Actions
- Actions
- Actions
- Actions
- Actions
- Actions
- Actions
- Actions
- Actions
- Actions
- Actions
- Actions
- Actions
- Actions
- Actions
- Actions
- Actions
- Actions
- Actions
- Actions
- Actions
- Actions
- Actions
- Actions
- Actions
- Actions
- Actions
- Actions
- Actions
- Actions
- Actions
- Actions
- Actions
- Actions
- Actions
- Actions
- Actions
- Actions
- Actions
- Actions
- Actions
- Actions
- Actions
- Actions
- Actions
- Actions
- Actions
- Actions
- Actions
- Actions
- Actions
- Actions
- Actions
- Actions
- Actions
- Actions
- Actions
- Actions
- Actions
- Actions
- Actions
- Actions
- Actions
- Actions
- Actions
- Actions
- Actions
- Actions
- Actions
- Actions
- Actions
- Actions
- Actions
- Actions
- Actions
- Actions
- Actions
- Actions
- Actions
- Actions
- Actions
- Actions
- Actions
- Actions
- Actions
- Actions
- Actions
- Actions
- Actions
- Actions
- Actions
Grants and funding
LinkOut - more resources
Full Text Sources
Other Literature Sources
Medical
Molecular Biology Databases
Research Materials

