

Multi-wavelength microflow cytometer using groove-generated sheath flow
- PMID: 19532970
- PMCID: PMC2719160
- DOI: 10.1039/b822442k
Multi-wavelength microflow cytometer using groove-generated sheath flow
Abstract
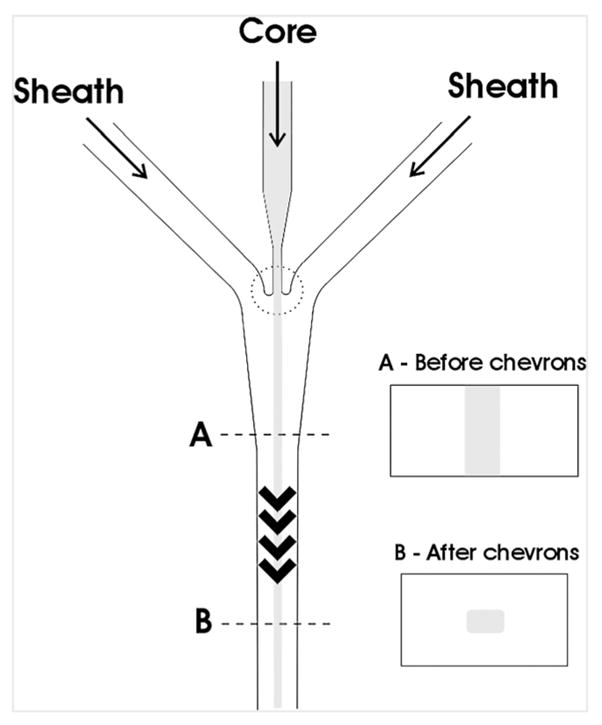
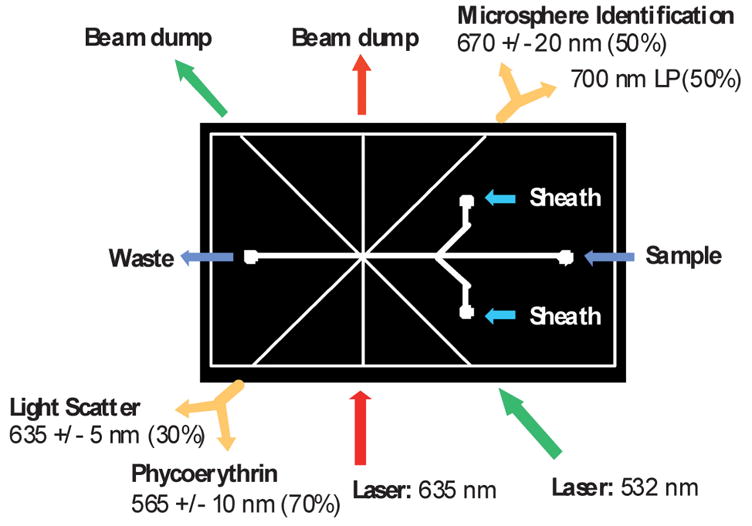
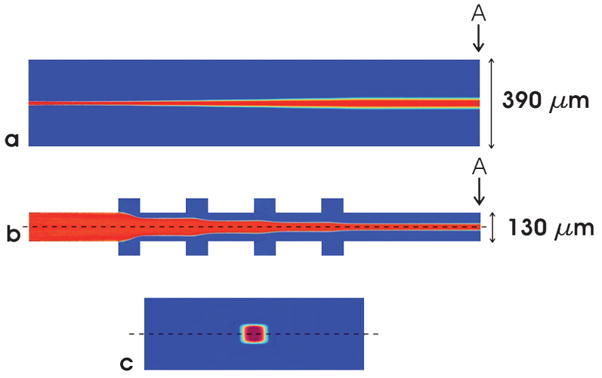
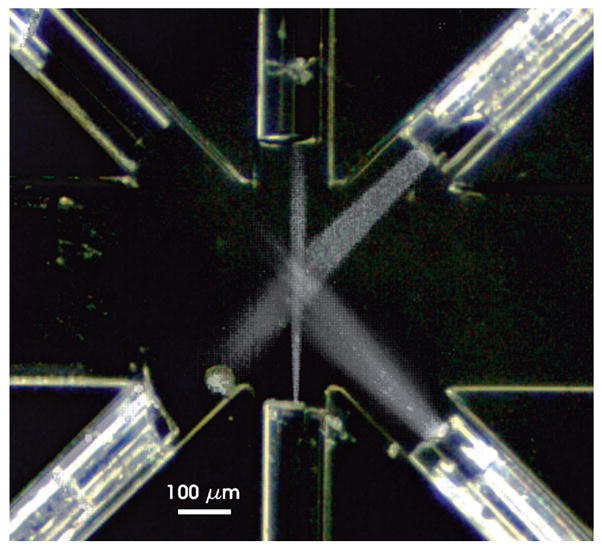
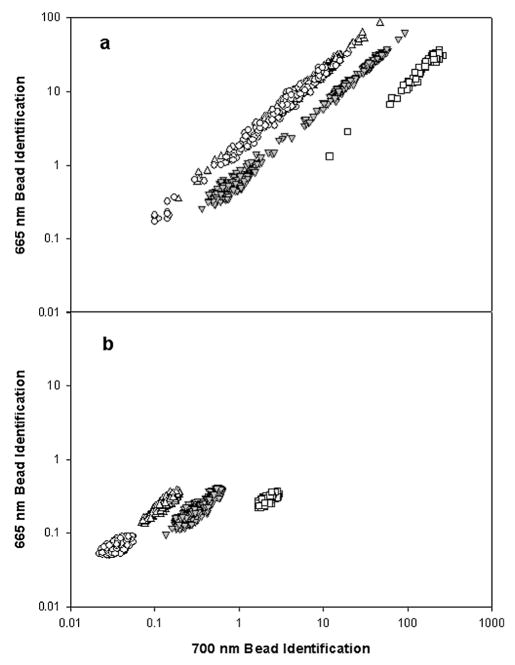
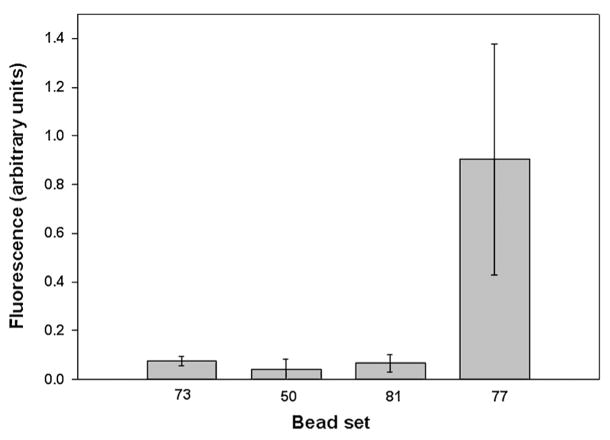
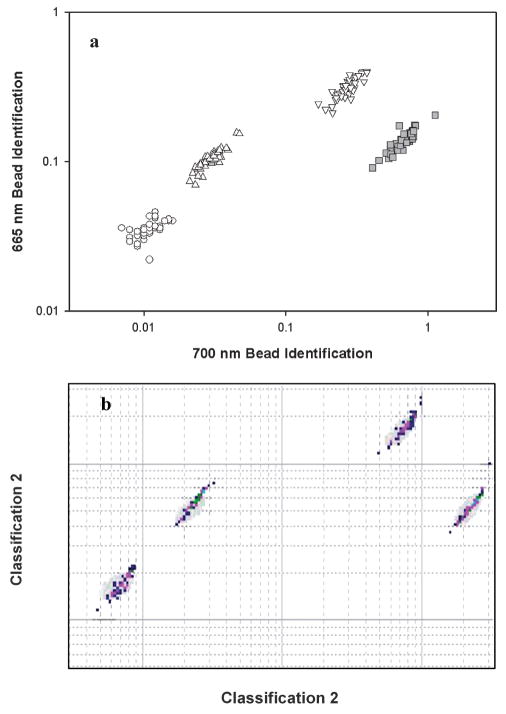
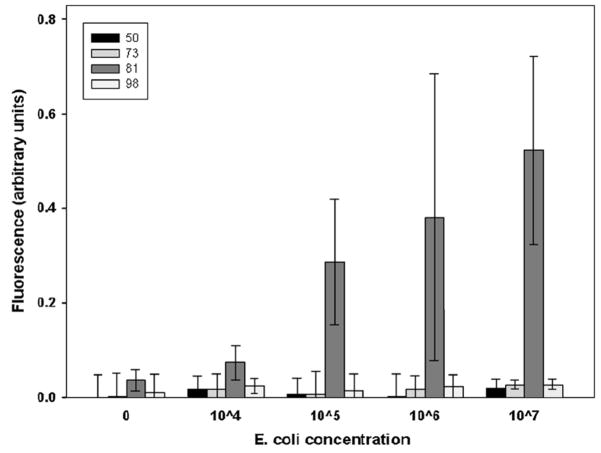
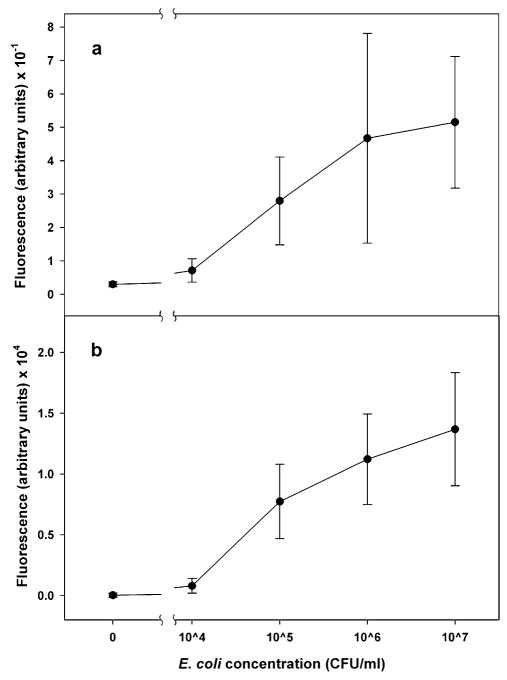
A microflow cytometer was developed that ensheathed the sample (core) fluid on all sides and interrogated each particle in the sample stream at four different wavelengths. Sheathing was achieved by first sandwiching the core fluid with the sheath fluid laterally via fluid focusing. Chevron-shaped groove features fabricated in the top and bottom of the channel directed sheath fluid from the sides to the top and bottom of the channel, completely surrounding the sample stream. Optical fibers inserted into guide channels provided excitation light from diode lasers at 532 and 635 nm and collected the emission wavelengths. Two emission collection fibers were connected to PMTs through a multimode fiber splitter and optical filters for detection at 635 nm (scatter), 665 nm and 700 nm (microsphere identification) and 565 nm (phycoerythrin tracer). The cytometer was capable of discriminating microspheres with different amounts of the fluorophores used for coding and detecting the presence of a phycoerythrin antibody complex on the surface of the microspheres. Assays for Escherichia coli were compared with a commercial Luminex flow cytometer.
Figures
Similar articles
-
Multiplexed detection of bacteria and toxins using a microflow cytometer.Anal Chem. 2009 Jul 1;81(13):5426-32. doi: 10.1021/ac9005827. Anal Chem. 2009. PMID: 19496600 Free PMC article.
-
Utilization of microparticles in next-generation assays for microflow cytometers.Anal Bioanal Chem. 2010 Nov;398(6):2373-82. doi: 10.1007/s00216-010-3848-8. Epub 2010 Jun 8. Anal Bioanal Chem. 2010. PMID: 20526882 Free PMC article. Review.
-
The intersection of flow cytometry with microfluidics and microfabrication.Lab Chip. 2014 Mar 21;14(6):1044-59. doi: 10.1039/c3lc51152a. Lab Chip. 2014. PMID: 24488050 Free PMC article. Review.
-
Optofluidic characterization of marine algae using a microflow cytometer.Biomicrofluidics. 2011 Sep;5(3):32009-320099. doi: 10.1063/1.3608136. Epub 2011 Sep 20. Biomicrofluidics. 2011. PMID: 22662031 Free PMC article.
-
Dynamic reversibility of hydrodynamic focusing for recycling sheath fluid.Lab Chip. 2010 Aug 7;10(15):1952-9. doi: 10.1039/c004696e. Epub 2010 May 17. Lab Chip. 2010. PMID: 20480064 Free PMC article.
Cited by
-
Particle focusing in staged inertial microfluidic devices for flow cytometry.Anal Chem. 2010 May 1;82(9):3862-7. doi: 10.1021/ac100387b. Anal Chem. 2010. PMID: 20373755 Free PMC article.
-
Multiplexed detection of bacteria and toxins using a microflow cytometer.Anal Chem. 2009 Jul 1;81(13):5426-32. doi: 10.1021/ac9005827. Anal Chem. 2009. PMID: 19496600 Free PMC article.
-
Utilization of microparticles in next-generation assays for microflow cytometers.Anal Bioanal Chem. 2010 Nov;398(6):2373-82. doi: 10.1007/s00216-010-3848-8. Epub 2010 Jun 8. Anal Bioanal Chem. 2010. PMID: 20526882 Free PMC article. Review.
-
Characterization of a microflow cytometer with an integrated three-dimensional optofluidic lens system.Biomicrofluidics. 2010 Dec 30;4(4):43005. doi: 10.1063/1.3502672. Biomicrofluidics. 2010. PMID: 21267437 Free PMC article.
-
The intersection of flow cytometry with microfluidics and microfabrication.Lab Chip. 2014 Mar 21;14(6):1044-59. doi: 10.1039/c3lc51152a. Lab Chip. 2014. PMID: 24488050 Free PMC article. Review.
References
-
- Shapiro HM. Practical flow cytometry. John Wiley and Sons; Hoboken, NJ: 2003.
-
- Fulton RJ, McDade RL, Smith PL, Kienker LJ, Kettman JR. Clinical Chemistry. 1997;43:1749–1756. - PubMed
-
- Pattanapanyasat K, Phuang-Ngern Y, Lerdwana S, Wasinrapee P, Sakulploy N, Noulsri E, Thepthai C, McNicholl JM. Cytometry Part B-Clinical Cytometry. 2007;72B:387–396. - PubMed
-
-
http://www.guavatechnologies.com/cm/Home.html .
-
-
-
http://www.luminexcorp.com .
-
Publication types
MeSH terms
Substances
Grants and funding
LinkOut - more resources
Full Text Sources
Other Literature Sources