

Therapeutic microRNA delivery suppresses tumorigenesis in a murine liver cancer model
- PMID: 19524505
- PMCID: PMC2722880
- DOI: 10.1016/j.cell.2009.04.021
Therapeutic microRNA delivery suppresses tumorigenesis in a murine liver cancer model
Abstract
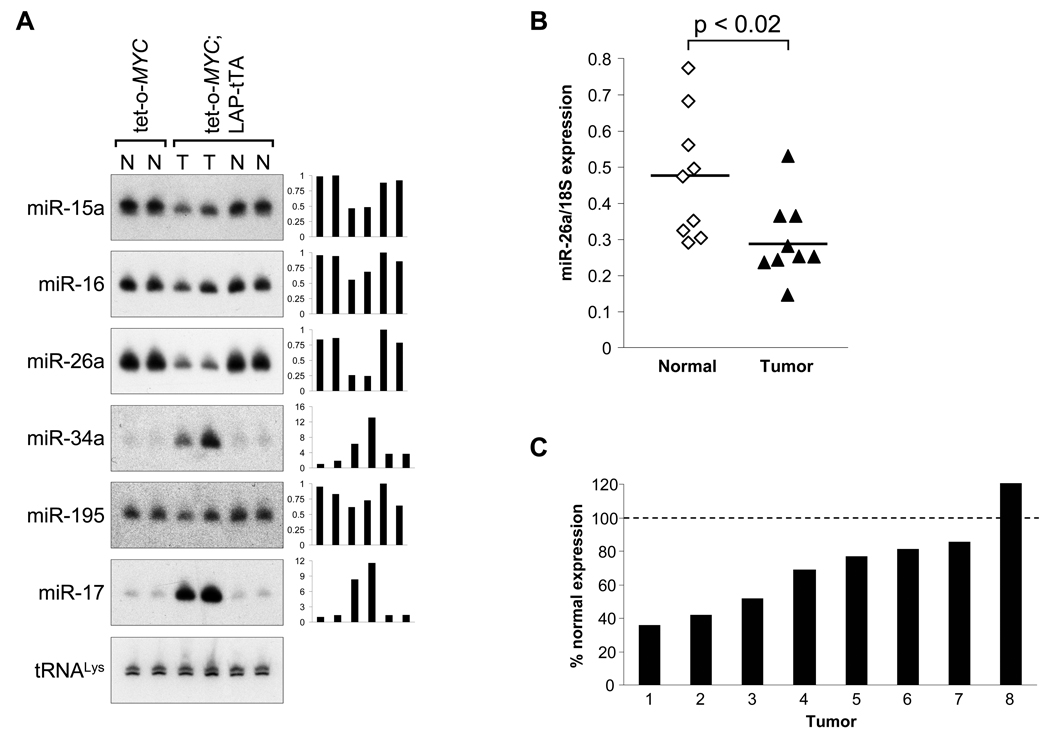
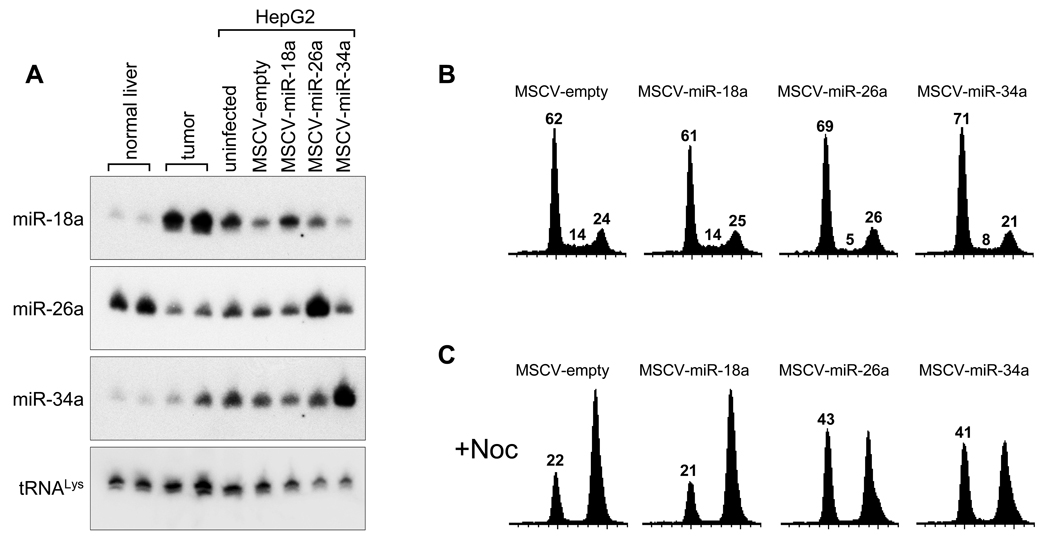
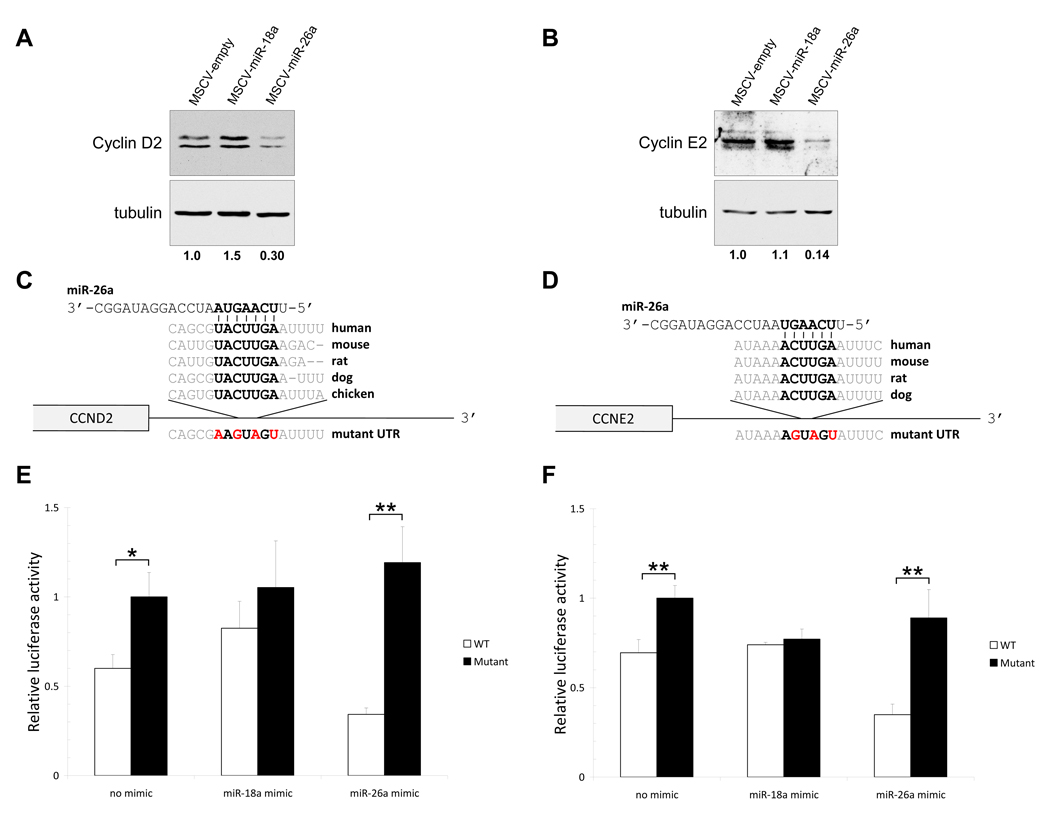
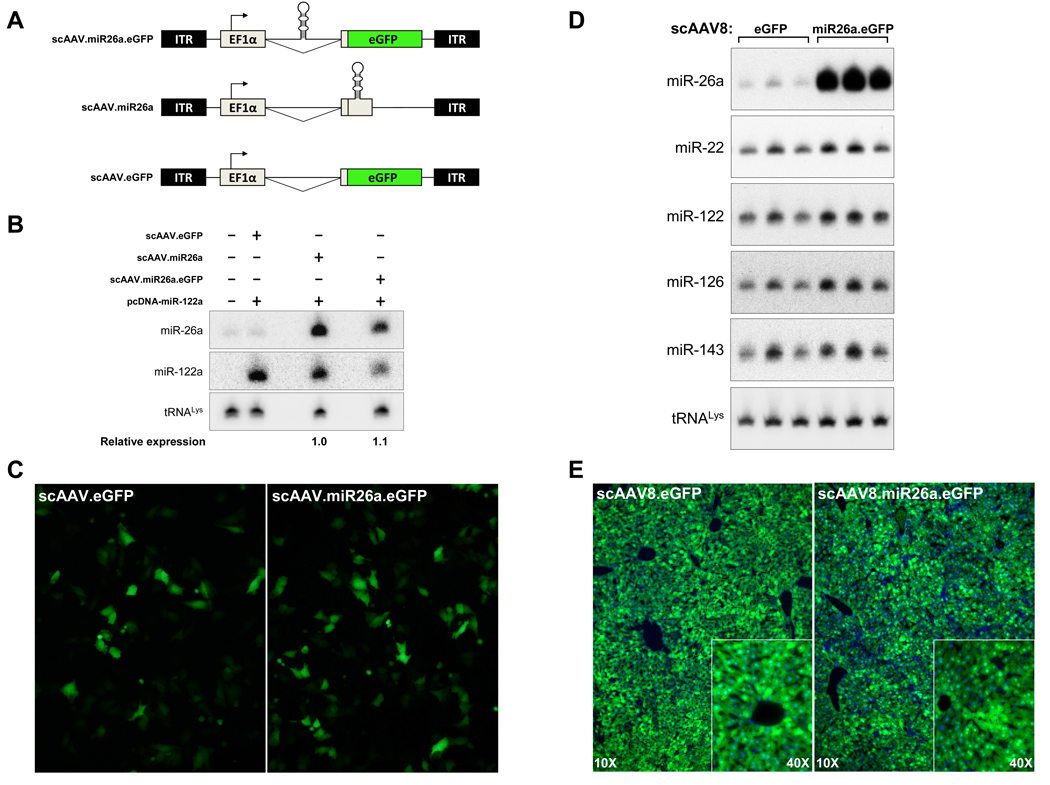
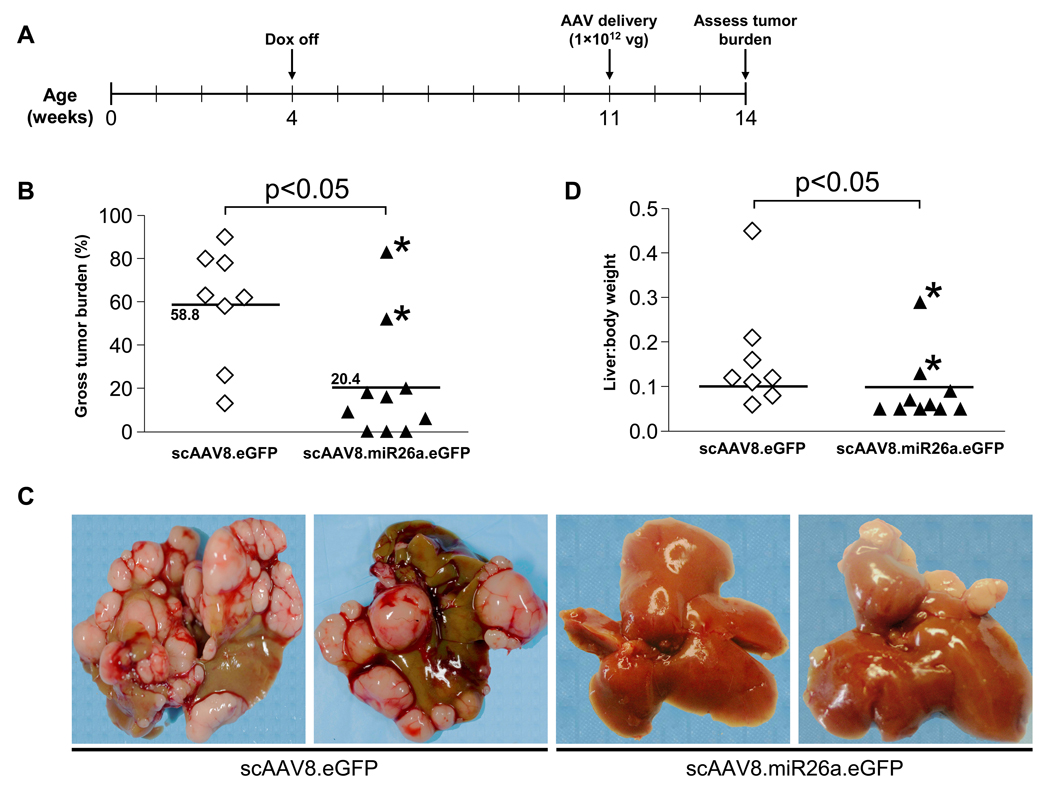
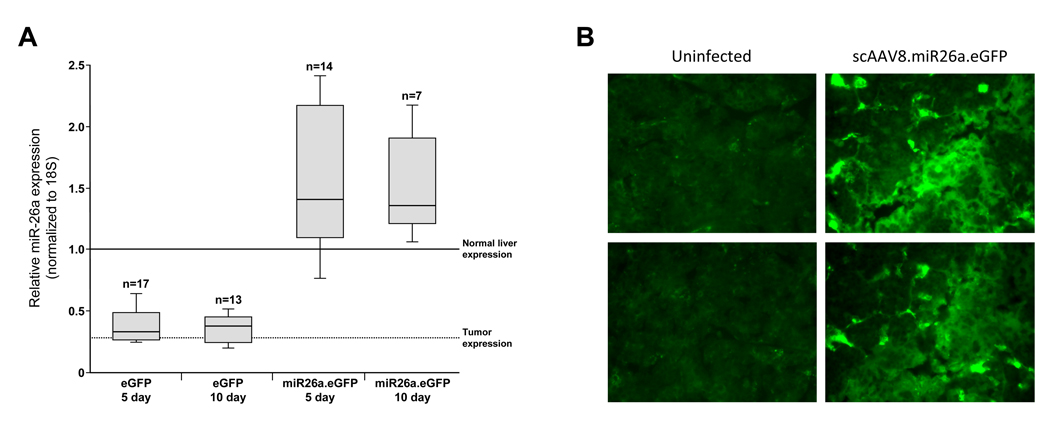
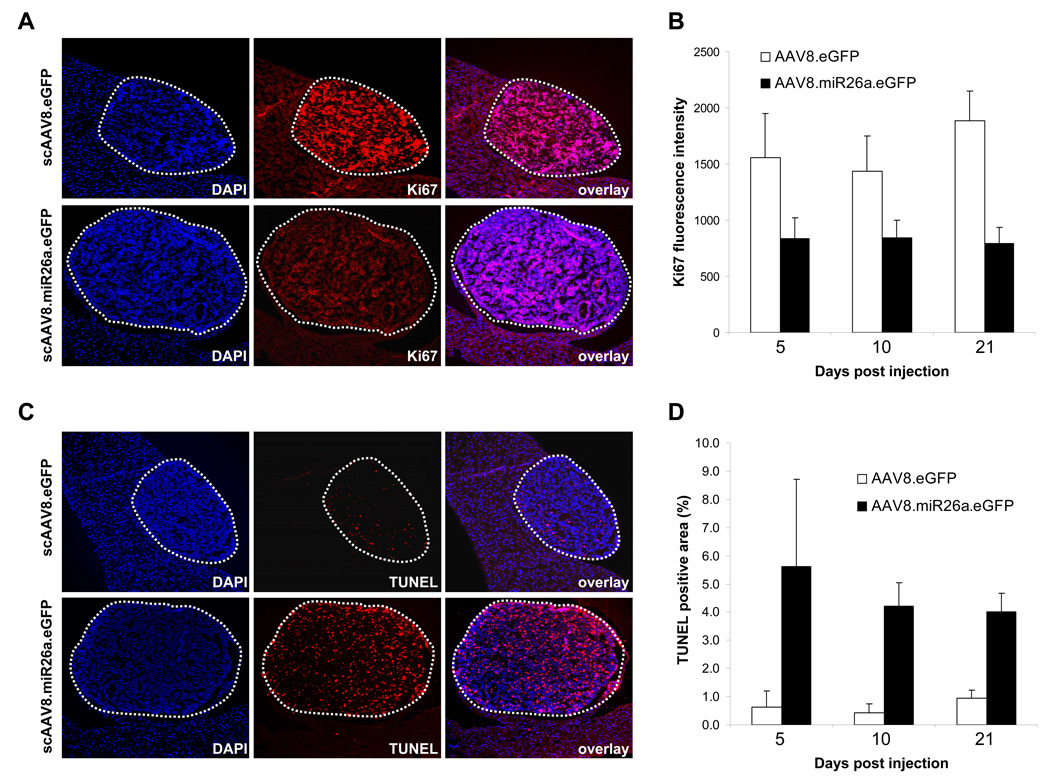
Therapeutic strategies based on modulation of microRNA (miRNA) activity hold great promise due to the ability of these small RNAs to potently influence cellular behavior. In this study, we investigated the efficacy of a miRNA replacement therapy for liver cancer. We demonstrate that hepatocellular carcinoma (HCC) cells exhibit reduced expression of miR-26a, a miRNA that is normally expressed at high levels in diverse tissues. Expression of this miRNA in liver cancer cells in vitro induces cell-cycle arrest associated with direct targeting of cyclins D2 and E2. Systemic administration of this miRNA in a mouse model of HCC using adeno-associated virus (AAV) results in inhibition of cancer cell proliferation, induction of tumor-specific apoptosis, and dramatic protection from disease progression without toxicity. These findings suggest that delivery of miRNAs that are highly expressed and therefore tolerated in normal tissues but lost in disease cells may provide a general strategy for miRNA replacement therapies.
Figures
Comment in
-
New hope for a microRNA therapy for liver cancer.Cell. 2009 Jun 12;137(6):990-2. doi: 10.1016/j.cell.2009.05.038. Cell. 2009. PMID: 19524500
-
miRNA delivery: emerging therapy for hepatocellular carcinoma.Gastroenterology. 2010 Mar;138(3):1202-4. doi: 10.1053/j.gastro.2010.01.024. Epub 2010 Jan 25. Gastroenterology. 2010. PMID: 20102759 No abstract available.
Similar articles
-
Preferential targeting of disseminated liver tumors using a recombinant adeno-associated viral vector.Hum Gene Ther. 2015 Feb;26(2):94-103. doi: 10.1089/hum.2014.052. Hum Gene Ther. 2015. PMID: 25569358 Free PMC article.
-
New hope for a microRNA therapy for liver cancer.Cell. 2009 Jun 12;137(6):990-2. doi: 10.1016/j.cell.2009.05.038. Cell. 2009. PMID: 19524500
-
MicroRNA-26a is a key regulon that inhibits progression and metastasis of c-Myc/EZH2 double high advanced hepatocellular carcinoma.Cancer Lett. 2018 Jul 10;426:98-108. doi: 10.1016/j.canlet.2018.04.005. Epub 2018 Apr 11. Cancer Lett. 2018. PMID: 29653269
-
MicroRNAs and liver cancer associated with iron overload: therapeutic targets unravelled.World J Gastroenterol. 2013 Aug 28;19(32):5212-26. doi: 10.3748/wjg.v19.i32.5212. World J Gastroenterol. 2013. PMID: 23983424 Free PMC article. Review.
-
The Promise of miRNA Replacement Therapy for Hepatocellular Carcinoma.Curr Gene Ther. 2019;19(5):290-304. doi: 10.2174/1566523219666191023101433. Curr Gene Ther. 2019. PMID: 31657677 Review.
Cited by
-
Comparison of Methods for miRNA Extraction from Plasma and Quantitative Recovery of RNA from Cerebrospinal Fluid.Front Genet. 2013 May 16;4:83. doi: 10.3389/fgene.2013.00083. eCollection 2013. Front Genet. 2013. PMID: 23720669 Free PMC article.
-
Gene therapy for advanced melanoma: selective targeting and therapeutic nucleic acids.J Drug Deliv. 2013;2013:897348. doi: 10.1155/2013/897348. Epub 2013 Mar 25. J Drug Deliv. 2013. PMID: 23634303 Free PMC article.
-
Mouse models for liver cancer.Mol Oncol. 2013 Apr;7(2):206-23. doi: 10.1016/j.molonc.2013.01.005. Epub 2013 Feb 5. Mol Oncol. 2013. PMID: 23428636 Free PMC article. Review.
-
microRNA-497 inhibits cell proliferation and induces apoptosis by targeting YAP1 in human hepatocellular carcinoma.FEBS Open Bio. 2016 Feb 1;6(2):155-64. doi: 10.1002/2211-5463.12032. eCollection 2016 Feb. FEBS Open Bio. 2016. Retraction in: FEBS Open Bio. 2022 Dec;12(12):2256. doi: 10.1002/2211-5463.13510. PMID: 27239437 Free PMC article. Retracted.
-
MicroRNAs as therapeutic targets in chemoresistance.Drug Resist Updat. 2013 Jul-Nov;16(3-5):47-59. doi: 10.1016/j.drup.2013.05.001. Epub 2013 Jun 10. Drug Resist Updat. 2013. PMID: 23757365 Free PMC article. Review.
References
-
- Alexander IE, Cunningham SC, Logan GJ, Christodoulou J. Potential of AAV vectors in the treatment of metabolic disease. Gene Ther. 2008;15:831–839. - PubMed
-
- Betel D, Wilson M, Gabow A, Marks DS, Sander C. The microRNA.org resource: targets and expression. Nucleic Acids Res. 2008;36:D149–D153. - PMC - PubMed
-
- Bommer GT, Gerin I, Feng Y, Kaczorowski AJ, Kuick R, Love RE, Zhai Y, Giordano TJ, Qin ZS, Moore BB, et al. p53-Mediated Activation of miRNA34 Candidate Tumor-Suppressor Genes. Curr Biol. 2007;17:1298–1307. - PubMed
Publication types
MeSH terms
Substances
Grants and funding
LinkOut - more resources
Full Text Sources
Other Literature Sources
Medical
Molecular Biology Databases
Research Materials
