. 2009 Jul 17;105(2):167-75.
doi: 10.1161/CIRCRESAHA.109.200311. Epub 2009 Jun 11.

L-type calcium channel blockers exert an antiinflammatory effect by suppressing expression of plasminogen receptors on macrophages

Affiliations

L-type calcium channel blockers exert an antiinflammatory effect by suppressing expression of plasminogen receptors on macrophages

Riku Das et al. Circ Res. .

Abstract

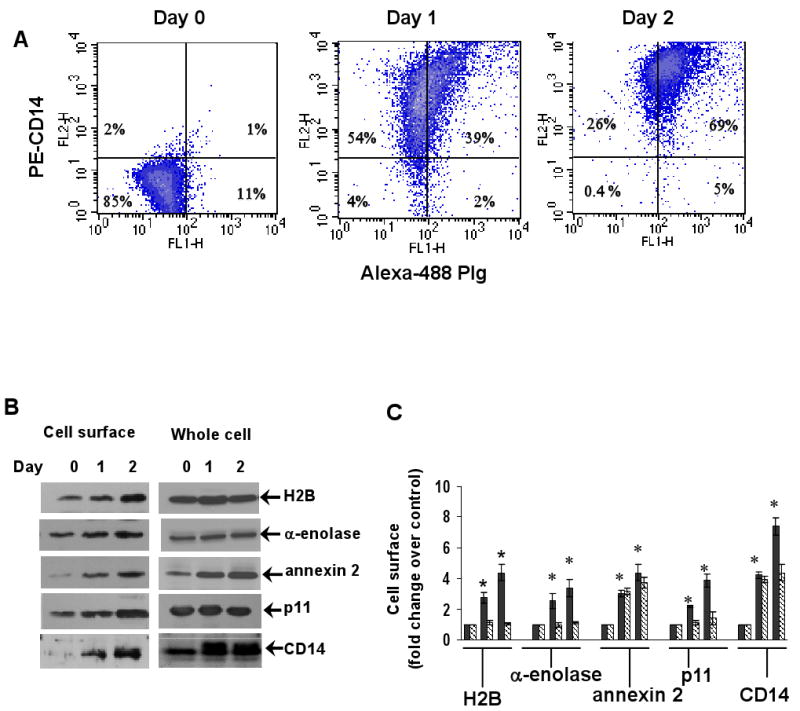
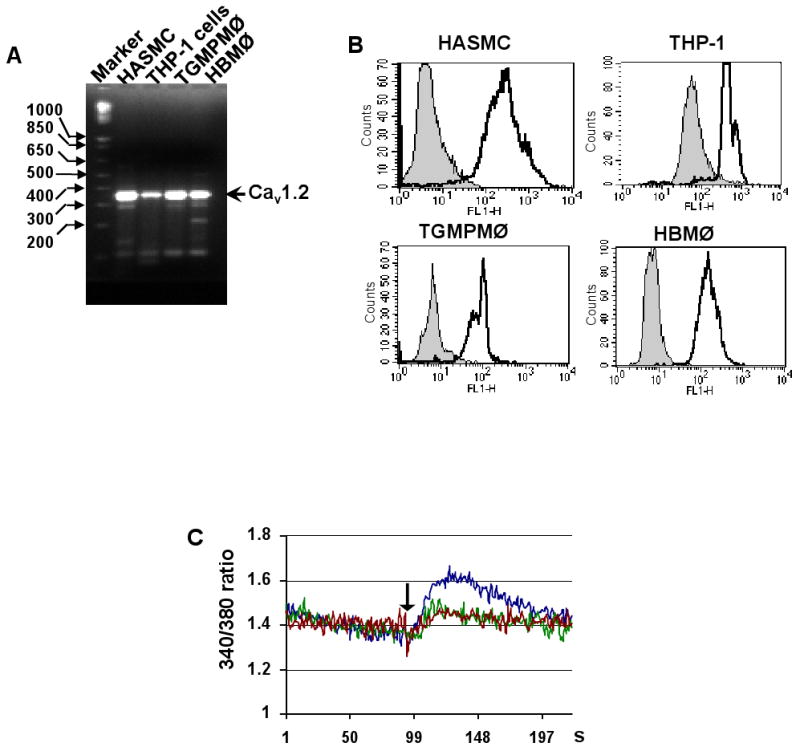
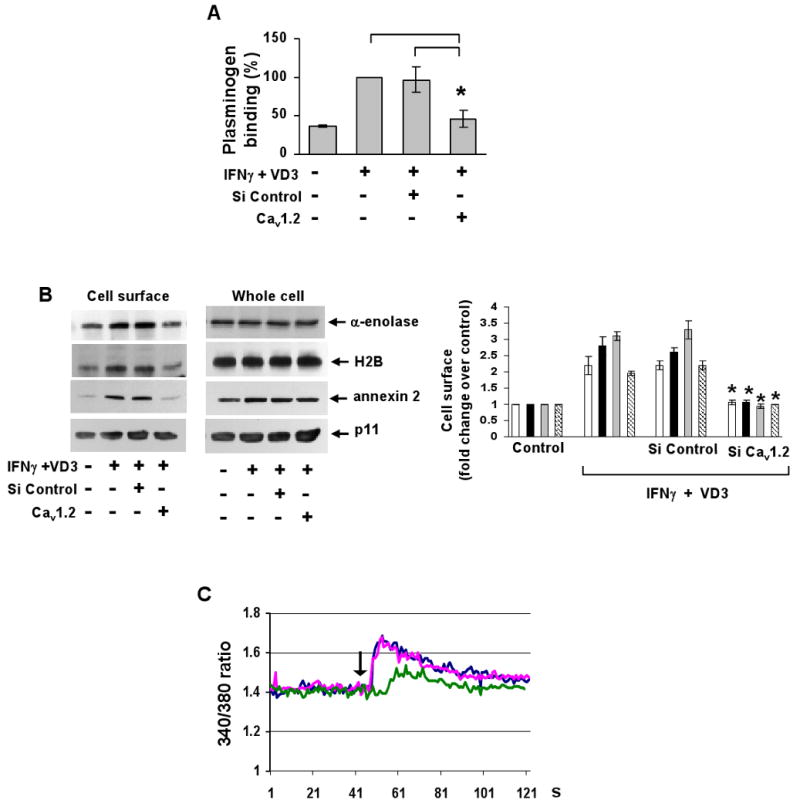
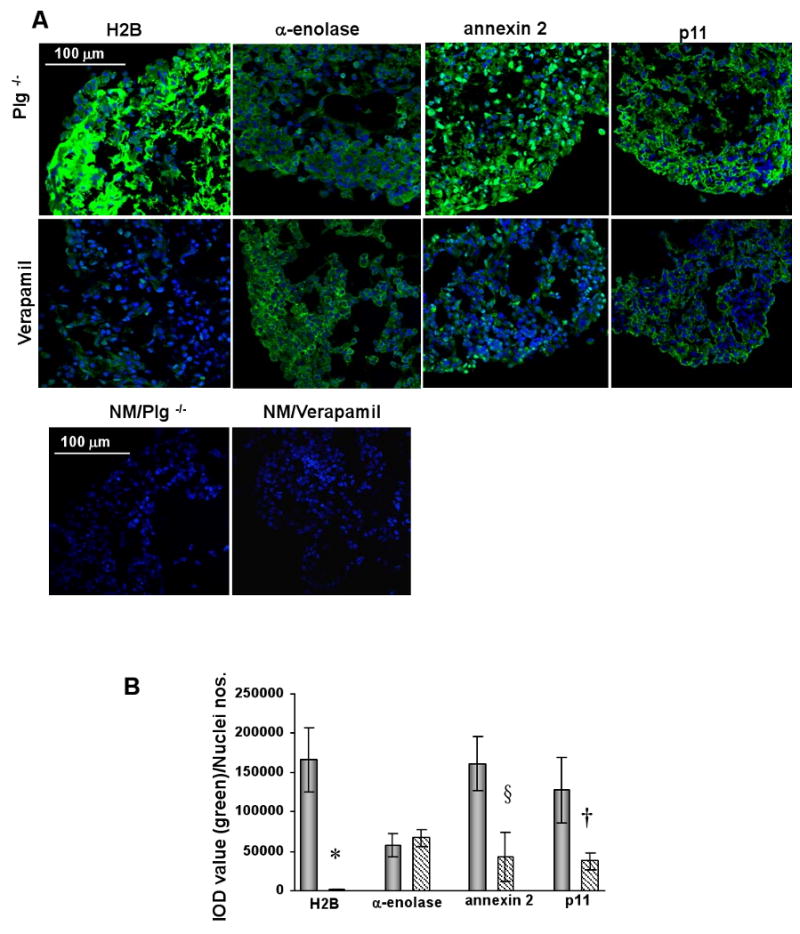
L-type Ca(2+) channel (LTCC) blockers, represented by amlodipine and verapamil, are widely used antihypertensive drugs that also have antiinflammatory activities. Plasminogen (Plg) is an important mediator of macrophage recruitment, and this role depends on its interaction with Plg receptors (Plg-Rs). Plg-Rs include histone 2B, alpha-enolase, annexin 2, and p11, all proteins which lack signal sequences for cell surface export. When human or murine monocytoid cells were induced to differentiate into macrophages, their Plg binding and Plg-R expression increased by 4-fold. These changes were suppressed by pretreatment with verapamil and amlodipine. Expression of the Ca(v)1.2 LTCC pore subunit was induced in differentiated macrophages, and siRNA against this subunit suppressed the upregulation of Plg binding and Plg-Rs. In vivo, amlodipine and verapamil suppressed peritoneal macrophage recruitment in response to thioglycollate by >60% at doses that did not affect blood pressure. In drug-treated animals, macrophages migrated into but not through the peritoneal membrane tissue and showed reduced surface expression of Plg-Rs. These findings demonstrate that Plg-R expression on macrophages is dependent on Ca(v)1.2 LTCC subunit expression. Suppression of Plg-Rs may contribute to the antiinflammatory effects of the widely used LTCC blockers.


Conflict of interest statement

Disclosures: None

Figures

Figure 1
Figure 1. Effect of differentiation of THP-1 monocytoid cells on plasminogen (Plg) binding
(A) THP-1 cells were stimulated with IFNγ+VD3 and FACS was performed immediately after stimulation (day 0), day 1 or day 2 with Alexa-488-Plg and PE-anti-CD14. Stimulation enhances Plg binding and CD14 expression. Data are representative of 3 independent experiments. (B) Western blots of cell surface Plg-Rs as biotinylated proteins, isolated on streptavidin beads, from THP-1 cells on days 0,1 or 2 after IFNγ+VD3. For comparison, Western blots of whole cell lysates show total cellular levels of the Plg-Rs. (C) Intensity of the Western blot bands are plotted as the fold increase of each Plg-R compared to non-stimulated THP-1 cells. Data are the means ± SD from triplicate blots. Striated bars, whole cell lysates; black bars, cell surface levels. *p ≤ 0.05 vs. corresponding protein on untreated cells.
Figure 2
Figure 2. Export pathways involved in enhanced Plg binding to differentiated THP-1 cells
THP-1 cells were pretreated for 1 hr with the indicated drugs and then differentiated with IFNγ+VD3 for 24 h. FACS of Alexa-488-Plg binding was performed as in Figure 1, assigning of Plg binding to the cells stimulated with IFNγ+VD3 a value of 100%. (A). Brefeldin A (ER/Golgi inhibitor), glyburide (ABC-1 inhibitor), methylamine (endolysosomal pathway inhibitor), and ouabain (Na+/K+-ATPase inhibitor) had minimal effects on Plg binding. (B) Pretreatment with the [Ca2+]in chelator, BAPTA-AM or blockers of L-type Ca2+ channels, amlodipine or verapamil, completely blocked the increase in Plg binding associated with differentiation. Pretreatment with inhibitors of P-type Ca2+ channels, ω-agatoxin IVA, or N-type Ca2+ channels, ω-conotoxin, or tempol, a SOD mimetic, had no significant effect on Plg binding. Ionomycin, a Ca2+ ionophore, increased Plg binding. The values are the mean fluorescence intensities from three independent FACS experiments. * indicates p ≤ 0.05 compared to Plg binding to IFNγ+VD3 stimulated cells in the absence of inhibitors.
Figure 3
Figure 3. Presence and function of L-type Ca2+ channels on human and mouse macrophages
(A) Agarose gels of the RT-PCR product amplified from RNA from human aortic smooth muscle cells (HASMC), THP-1 cells, thioglycollate induced mouse peritoneal macrophages (TGMPMΦ) and human peripheral blood monocyte-derived macrophages (HBMΦ) reveal expression of Cav11.2 mRNA (n= 3). (B) FACS with anti-Cav1.2 (black open histogram) or anti-Cav1.2 preincubated with the antigen peptide (gray solid histogram) show the presence of the LTCC. Representative of three experiments. (C) Increase in [Ca2+]in induced by fLMP in differentiated THP-1 cells (day 2 after IFNγ+VD3) is inhibited by amlodipine (100 μmol/L, green) or verapamil (100 μmol/L, red). [Ca2+]in data representative of four experiments.
Figure 4
Figure 4. Role of LTCC and [Ca2+]in in surface expression of Plg-Rs
THP-1 cells were pretreated with BAPTA-AM (A)or amlodipine and verapamil (B) for 45-60 min and then treated with IFNγ+VD3 for 24 h. Western blots of biotinylated proteins show inhibition of surface expression of α-enolase, H2B, annexin 2 and p11 without affecting whole cell levels of these proteins. (A&B) Bars are derived from densitometry of cell surface bands relative to unstimulated controls, calculated from three separate blots: α-enolase (open bars), H2B (black bars), annexin 2 (gray bars) and p11 (striated bars). *p ≤ 0.05 compared to corresponding Plg-R levels in IFNγ + VD3 treated cells.
Figure 5
Figure 5. Cav1.2 siRNA decreases differentiation induced Plg binding, surface expression of Plg-Rs and [Ca2+]in
THP-1 cells were either untreated or transfected with siRNA to Cav1.2 (SiCav1.2) or a control siRNA (SiControl) and then stimulated with IFNγ+VD3 for 1 or 2 days. Differentiation induced Plg binding (A), Plg-R cell surface expression (B) and fMLP stimulated [Ca2+]in (C) is suppressed by SiCav1.2 compared to untreated or SiControl treated cells (C, blue; differentiated THP-1 cells, pink; SiControl differentiated, green; SiCav1.2 differentiated). Plg binding is the mean fluorescence intensities of FACS from three independent experiments. Bars show densitometry of cell surface bands relative to unstimulated controls, calculated from three separate blots: α-enolase (open bars), H2B (black bars), annexin 2 (gray bars) and p11 (striated bars). Data are the means ± SD from triplicate blots. * p ≤ 0.05 compared to Plg binding/Plg-Rs expression to IFNγ+VD3 stimulated cells. [Ca2+]in data is representative of four experiments.
Figure 6
Figure 6. Effect of amlodipine and verapamil on thioglycollate-induced macrophage recruitment in vivo
(A) Inflammation was induced by i.p. TG into Plg+/+ mice either untreated, treated with vehicles (DMSO for amlodipine or saline for verapamil) or treated with two concentrations of amlodipine and verapamil administered via subcutaneous osmotic minipumps. Macrophages recruited into the peritoneal cavity were quantified by measurement of non-specific esterase activity in the lavage collected 72 h after TG. *p≤0.004 for amlodipine vs. vehicle, n=8 and for §p0.001 for verapamil vs. vehicle, n = 8. (B) Representative photomicrographs of H&E stained PM sections from mice 72 hr after TG. (C) Representative anti-Mac3 staining (brown) of PM sections of TG treated mice showing extensive macrophage accumulation at the PM of amlodipine and verapamil treated mice compared to their vehicles. Nuclei are stained with hemotoxylin (blue). Images are representative of multiple PM sections derived from 3 mice per group. Original magnification, 10×. (D) Quantification of Mac3 staining per area of PM (%) quantified with Image Pro-plus shows increased accumulation of macrophages in amlodipine or verapamil treated mice: *p = 0.001 vs. DMSO, n = 3 and §p =0.001 vs. Saline, n = 3.
Figure 7
Figure 7. Effects of amlodipine and verapamil on Plg-R expression on macrophages arrested in the peritoneal membrane
Confocal microscopic images of sections of PM harvested from mice 72 h after TG induced inflammation. Plg-/- mice or WT mice treated with amlodipine and verapamil or the drug vehicles. The PM was stained with either rabbit antibodies to the individual Plg-R or non-immune (NM) IgG. Nuclei are stained blue with DAPI. Images are representative of multiple areas of multiple slides at 63× magnification. (B) Quantification of fluorescence intensities of the individual Plg-Rs on the cell surface and ECM of mice treated with verapamil compared to the Plg-/- mice. H2B, annexin 2 and p11 in the PM of the verapamil treated mice compared to the same Plg-Rs in the Plg-/- mice are significantly reduced in the drug treated mice: *p = 0.002 for H2B in verapamil treated vs. Plg-/- mice, §p = 0.01 for annexin 2 in the verapamil treated mice vs. the Plg-/- mice, and †p = 0.02 for p11 in the verapamil treated vs. the Plg-/- mice, n = 3. α-enolase expression was not significantly different in verapamil treated vs. Plg-/- mice.

Comment in

Similar articles

Cited by

References

    1. Moons L, Shi C, Ploplis V, Plow E, Haber E, Collen D, Carmeliet P. Reduced transplant arteriosclerosis in plasminogen-deficient mice. J Clin Invest. 1998;102:1788–97. - PMC - PubMed
    1. Li J, Ny A, Leonardsson G, Nandakumar KS, Holmdahl R, Ny T. The plasminogen activator/plasmin system is essential for development of the joint inflammatory phase of collagen type II-induced arthritis. Am J Pathol. 2005;166:783–92. - PMC - PubMed
    1. Ploplis VA, French EL, Carmeliet P, Collen D, Plow EF. Plasminogen deficiency differentially affects recruitment of inflammatory cell populations in mice. Blood. 1998;91:2005–9. - PubMed
    1. Swaisgood CM, Aronica MA, Swaidani S, Plow EF. Plasminogen is an important regulator in the pathogenesis of a murine model of asthma. Am J Respir Crit Care Med. 2007;176:333–42. - PMC - PubMed
    1. Plow EF, Herren T, Redlitz A, Miles LA, Hoover-Plow JL. The cell biology of the plasminogen system. FASEB J. 1995;9:939–45. - PubMed

Publication types

MeSH terms