

Increased beta-amyloid levels in the choroid plexus following lead exposure and the involvement of low-density lipoprotein receptor protein-1
- PMID: 19501112
- PMCID: PMC2753690
- DOI: 10.1016/j.taap.2009.05.024
Increased beta-amyloid levels in the choroid plexus following lead exposure and the involvement of low-density lipoprotein receptor protein-1
Abstract
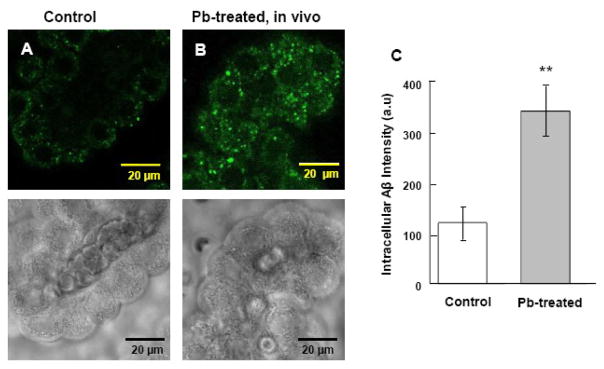
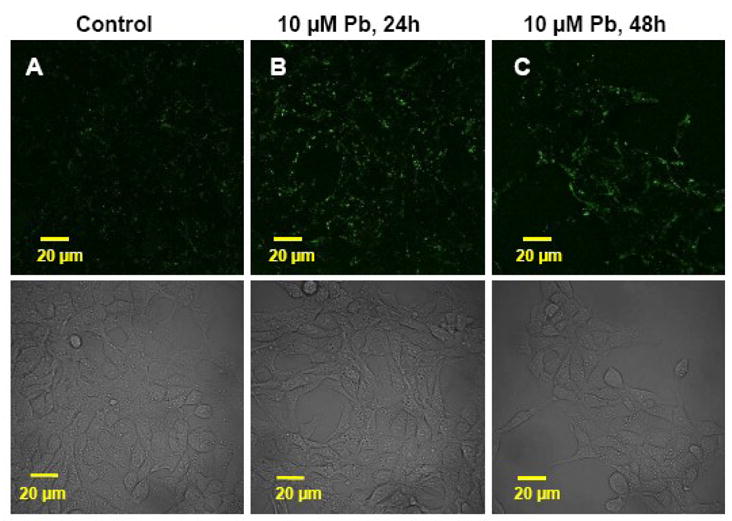
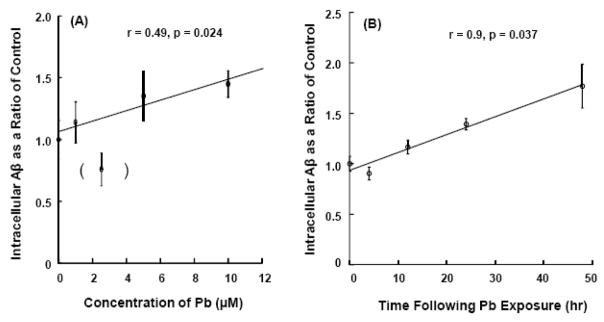
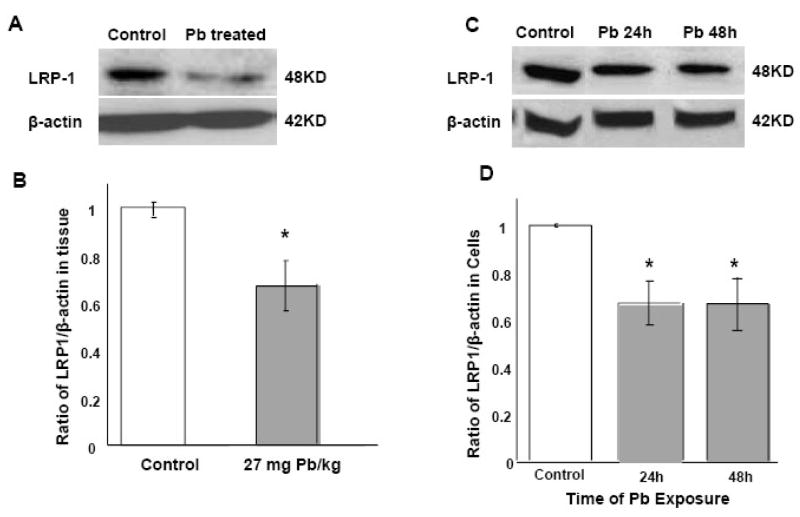
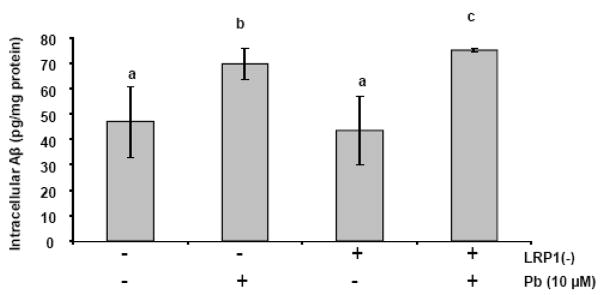
The choroid plexus, a barrier between the blood and cerebrospinal fluid (CSF), is known to accumulate lead (Pb) and also possibly function to maintain brain's homeostasis of Abeta, an important peptide in the etiology of Alzheimer's disease. This study was designed to investigate if Pb exposure altered Abeta levels at the blood-CSF barrier in the choroid plexus. Rats received ip injection of 27 mg Pb/kg. Twenty-four hours later, a FAM-labeled Abeta (200 pmol) was infused into the lateral ventricle and the plexus tissues were removed to quantify Abeta accumulation. Results revealed a significant increase in intracellular Abeta accumulation in the Pb-exposed animals compared to controls (p<0.001). When choroidal epithelial Z310 cells were treated with 10 microM Pb for 24 h and 48 h, Abeta (2 microM in culture medium) accumulation was significantly increased by 1.5 fold (p<0.05) and 1.8 fold (p<0.05), respectively. To explore the mechanism, we examined the effect of Pb on low-density lipoprotein receptor protein-1 (LRP1), an intracellular Abeta transport protein. Following acute Pb exposure with the aforementioned dose regimen, levels of LRP1 mRNA and proteins in the choroid plexus were decreased by 35% (p<0.05) and 31.8% (p<0.05), respectively, in comparison to those of controls. In Z310 cells exposed to 10 microM Pb for 24 h and 48 h, a 33.1% and 33.4% decrease in the protein expression of LRP1 was observed (p<0.05), respectively. Knocking down LRP1 resulted in even more substantial increases of cellular accumulation of Abeta, from 31% in cells without knockdown to 72% in cells with LRP1 knockdown (p<0.05). Taken together, these results suggest that the acute exposure to Pb results in an increased accumulation of intracellular Abeta in the choroid plexus; the effect appears to be mediated, at least in part, via suppression of LRP1 production following Pb exposure.
Figures


Similar articles
-
Lead-induced accumulation of beta-amyloid in the choroid plexus: role of low density lipoprotein receptor protein-1 and protein kinase C.Neurotoxicology. 2010 Sep;31(5):524-32. doi: 10.1016/j.neuro.2010.05.004. Epub 2010 May 19. Neurotoxicology. 2010. PMID: 20488202 Free PMC article.
-
Altered clearance of beta-amyloid from the cerebrospinal fluid following subchronic lead exposure in rats: Roles of RAGE and LRP1 in the choroid plexus.J Trace Elem Med Biol. 2020 Apr 8;61:126520. doi: 10.1016/j.jtemb.2020.126520. Online ahead of print. J Trace Elem Med Biol. 2020. PMID: 32325398 Free PMC article.
-
Involvement of CTR1 and ATP7A in lead (Pb)-induced copper (Cu) accumulation in choroidal epithelial cells.Toxicol Lett. 2014 Feb 10;225(1):110-8. doi: 10.1016/j.toxlet.2013.11.034. Epub 2013 Dec 6. Toxicol Lett. 2014. PMID: 24316150 Free PMC article.
-
Clearance of amyloid-β peptide across the choroid plexus in Alzheimer's disease.Curr Aging Sci. 2010 Dec;3(3):219-29. doi: 10.2174/1874609811003030219. Curr Aging Sci. 2010. PMID: 20735345 Review.
-
Endothelial LRP1 - A Potential Target for the Treatment of Alzheimer's Disease : Theme: Drug Discovery, Development and Delivery in Alzheimer's Disease Guest Editor: Davide Brambilla.Pharm Res. 2017 Dec;34(12):2637-2651. doi: 10.1007/s11095-017-2267-3. Epub 2017 Sep 25. Pharm Res. 2017. PMID: 28948494 Review.
Cited by
-
Targeting Mediators of Smoking Persistence with Intranasal Insulin.Front Pharmacol. 2017 Oct 4;8:706. doi: 10.3389/fphar.2017.00706. eCollection 2017. Front Pharmacol. 2017. PMID: 29085297 Free PMC article. Review.
-
The role of choroid plexus in IVIG-induced beta-amyloid clearance.Neuroscience. 2014 Jun 13;270:168-176. doi: 10.1016/j.neuroscience.2014.04.011. Epub 2014 Apr 16. Neuroscience. 2014. PMID: 24747018 Free PMC article.
-
Acrylamide exposure impairs blood-cerebrospinal fluid barrier function.Neural Regen Res. 2014 Mar 1;9(5):555-60. doi: 10.4103/1673-5374.130080. Neural Regen Res. 2014. PMID: 25206854 Free PMC article.
-
High affinity of β-amyloid proteins to cerebral capillaries: implications in chronic lead exposure-induced neurotoxicity in rats.Fluids Barriers CNS. 2023 May 1;20(1):32. doi: 10.1186/s12987-023-00432-5. Fluids Barriers CNS. 2023. PMID: 37122007 Free PMC article.
-
Targeting the Choroid Plexuses for Protein Drug Delivery.Pharmaceutics. 2020 Oct 14;12(10):963. doi: 10.3390/pharmaceutics12100963. Pharmaceutics. 2020. PMID: 33066423 Free PMC article. Review.
References
-
- Atkins DS, Basha MR, Zawia NH. Intracellular signaling pathways involved in mediating the effects of lead on the transcription factor Sp1. International Journal of Developmental Neuroscience. 2003;21:235–244. - PubMed
-
- Basha MR, Murali M, Siddiqi HK, Ghosal K, Siddiqi OK, Lashuel HA, Ge YW, Lahiri DK, Zawia NH. Lead (Pb) exposure and its effect on APP proteolysis and Aβ aggregation. The FASEB Journal express article. 2005b;10:1–16. - PubMed
Publication types
MeSH terms
Substances
Grants and funding
LinkOut - more resources
Full Text Sources
Research Materials
Miscellaneous
