

Measurement of internal body time by blood metabolomics
- PMID: 19487679
- PMCID: PMC2689311
- DOI: 10.1073/pnas.0900617106
Measurement of internal body time by blood metabolomics
Abstract
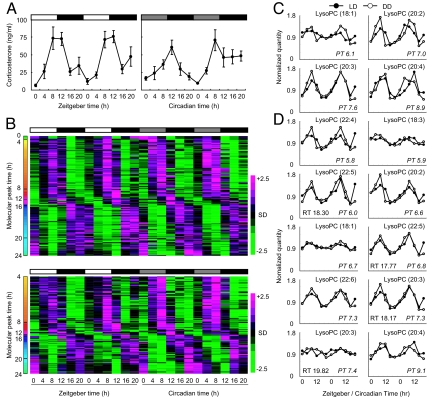
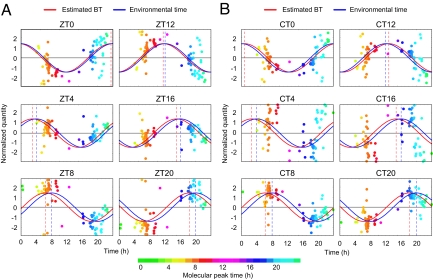
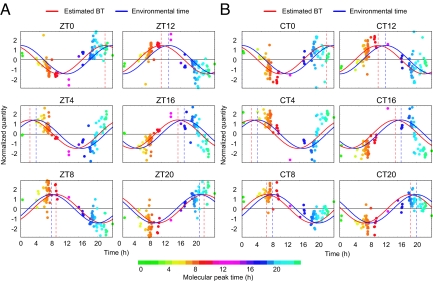
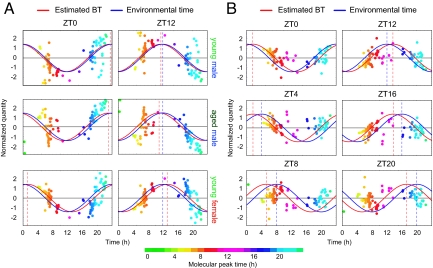
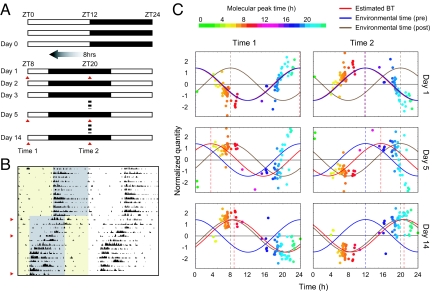
Detection of internal body time (BT) via a few-time-point assay has been a longstanding challenge in medicine, because BT information can be exploited to maximize potency and minimize toxicity during drug administration and thus will enable highly optimized medication. To address this challenge, we previously developed the concept, "molecular-timetable method," which was originally inspired by Linné's flower clock. In Linné's flower clock, one can estimate the time of the day by watching the opening and closing pattern of various flowers. Similarly, in the molecular-timetable method, one can measure the BT of the day by profiling the up and down patterns of substances in the molecular timetable. To make this method clinically feasible, we now performed blood metabolome analysis and here report the successful quantification of hundreds of clock-controlled metabolites in mouse plasma. Based on circadian blood metabolomics, we can detect individual BT under various conditions, demonstrating its robustness against genetic background, sex, age, and feeding differences. The power of this method is also demonstrated by the sensitive and accurate detection of circadian rhythm disorder in jet-lagged mice. These results suggest the potential for metabolomics-based detection of BT ("metabolite-timetable method"), which will lead to the realization of chronotherapy and personalized medicine.
Conflict of interest statement
The authors declare no conflict of interest.
Figures
Similar articles
-
Human blood metabolite timetable indicates internal body time.Proc Natl Acad Sci U S A. 2012 Sep 11;109(37):15036-41. doi: 10.1073/pnas.1207768109. Epub 2012 Aug 27. Proc Natl Acad Sci U S A. 2012. PMID: 22927403 Free PMC article.
-
Molecular-timetable methods for detection of body time and rhythm disorders from single-time-point genome-wide expression profiles.Proc Natl Acad Sci U S A. 2004 Aug 3;101(31):11227-32. doi: 10.1073/pnas.0401882101. Epub 2004 Jul 23. Proc Natl Acad Sci U S A. 2004. PMID: 15273285 Free PMC article.
-
Effects of chronic jet lag on the central and peripheral circadian clocks in CBA/N mice.Chronobiol Int. 2014 Mar;31(2):189-98. doi: 10.3109/07420528.2013.837478. Epub 2013 Oct 22. Chronobiol Int. 2014. PMID: 24147659
-
Translational Metabolomics of Head Injury: Exploring Dysfunctional Cerebral Metabolism with Ex Vivo NMR Spectroscopy-Based Metabolite Quantification.In: Kobeissy FH, editor. Brain Neurotrauma: Molecular, Neuropsychological, and Rehabilitation Aspects. Boca Raton (FL): CRC Press/Taylor & Francis; 2015. Chapter 25. In: Kobeissy FH, editor. Brain Neurotrauma: Molecular, Neuropsychological, and Rehabilitation Aspects. Boca Raton (FL): CRC Press/Taylor & Francis; 2015. Chapter 25. PMID: 26269925 Free Books & Documents. Review.
-
[Molecular and Neural Mechanisms for the Robustness of the Circadian Clock].Yakugaku Zasshi. 2015;135(11):1265-72. doi: 10.1248/yakushi.15-00206. Yakugaku Zasshi. 2015. PMID: 26521875 Review. Japanese.
Cited by
-
Human peripheral clocks: applications for studying circadian phenotypes in physiology and pathophysiology.Front Neurol. 2015 May 13;6:95. doi: 10.3389/fneur.2015.00095. eCollection 2015. Front Neurol. 2015. PMID: 26029154 Free PMC article. Review.
-
Mass spectrometry-based absolute quantification reveals rhythmic variation of mouse circadian clock proteins.Proc Natl Acad Sci U S A. 2016 Jun 14;113(24):E3461-7. doi: 10.1073/pnas.1603799113. Epub 2016 May 31. Proc Natl Acad Sci U S A. 2016. PMID: 27247408 Free PMC article.
-
Therapeutic applications of circadian rhythms for the cardiovascular system.Front Pharmacol. 2015 Apr 17;6:77. doi: 10.3389/fphar.2015.00077. eCollection 2015. Front Pharmacol. 2015. PMID: 25941487 Free PMC article. Review.
-
Punctual transcriptional regulation by the rice circadian clock under fluctuating field conditions.Plant Cell. 2015 Mar;27(3):633-48. doi: 10.1105/tpc.114.135582. Epub 2015 Mar 10. Plant Cell. 2015. PMID: 25757473 Free PMC article.
-
Coordination of the transcriptome and metabolome by the circadian clock.Proc Natl Acad Sci U S A. 2012 Apr 3;109(14):5541-6. doi: 10.1073/pnas.1118726109. Epub 2012 Mar 19. Proc Natl Acad Sci U S A. 2012. PMID: 22431615 Free PMC article.
References
-
- Dunlap JC, Loros JJ, DeCoursey PJ, editors. Chronobiology: Biological Timekeeping. Sunderland, MS: Sinauer; 2004.
-
- Reppert SM, Weaver DR. Coordination of circadian timing in mammals. Nature. 2002;418:935–941. - PubMed
-
- Ueda HR. Systems biology of mammalian circadian clocks. Cold Spring Harb Symp Quant Biol. 2007;72:365–380. - PubMed
-
- Akhtar RA, et al. Circadian cycling of the mouse liver transcriptome, as revealed by cdna microarray, is driven by the suprachiasmatic nucleus. Curr Biol. 2002;12:540–550. - PubMed
Publication types
MeSH terms
LinkOut - more resources
Full Text Sources
Other Literature Sources
Medical
Molecular Biology Databases
