

Differentially expressed genes strongly correlated with femur strength in rats
- PMID: 19482074
- PMCID: PMC3052638
- DOI: 10.1016/j.ygeno.2009.05.008
Differentially expressed genes strongly correlated with femur strength in rats
Abstract
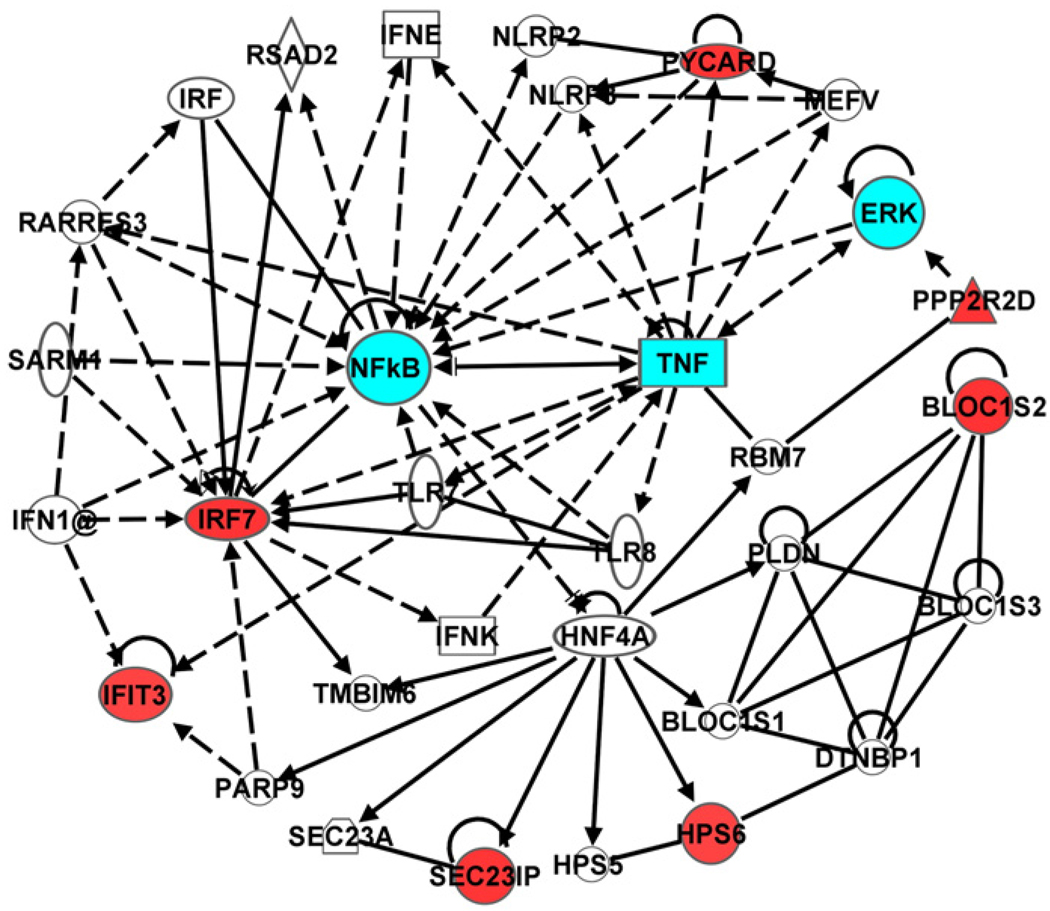
The region of chromosome 1q33-q54 harbors quantitative trait loci (QTL) for femur strength in COPxDA and F344xLEW F2 rats. The purpose of this study is to identify the genes within this QTL region that contribute to the variation in femur strength. Microarray analysis was performed using RNA extracted from femurs of COP, DA, F344 and LEW rats. Genes differentially expressed in the 1q33-q54 region among these rat strains were then ranked based on the strength of correlation with femur strength in F2 animals derived from these rats. A total of 214 genes in this QTL region were differentially expressed among all rat strains, and 81 genes were found to be strongly correlated (r(2)>0.50) with femur strength. Of these, 12 candidate genes were prioritized for further validation, and 8 of these genes (Ifit3, Ppp2r5b, Irf7, Mpeg1, Bloc1s2, Pycard, Sec23ip, and Hps6) were confirmed by quantitative PCR (qPCR). Ingenuity Pathway Analysis suggested that these genes were involved in interferon alpha, nuclear factor-kappa B (NFkB), extracellular signal-related kinase (ERK), hepatocyte nuclear factor 4 alpha (HNF4A) and tumor necrosis factor (TNF) pathways.
Figures

Similar articles
-
Genomic expression analysis of rat chromosome 4 for skeletal traits at femoral neck.Physiol Genomics. 2008 Oct 8;35(2):191-6. doi: 10.1152/physiolgenomics.90237.2008. Epub 2008 Aug 26. Physiol Genomics. 2008. PMID: 18728226 Free PMC article.
-
Genes influencing spinal bone mineral density in inbred F344, LEW, COP, and DA rats.Funct Integr Genomics. 2010 Mar;10(1):63-72. doi: 10.1007/s10142-009-0147-6. Epub 2009 Oct 15. Funct Integr Genomics. 2010. PMID: 19841953 Free PMC article.
-
Whole-genome scan for linkage to bone strength and structure in inbred Fischer 344 and Lewis rats.J Bone Miner Res. 2005 Sep;20(9):1589-96. doi: 10.1359/JBMR.050512. Epub 2005 May 23. J Bone Miner Res. 2005. PMID: 16059631
-
Genetic loci affecting bone structure and strength in inbred COP and DA rats.Bone. 2008 Mar;42(3):547-53. doi: 10.1016/j.bone.2007.11.004. Epub 2007 Nov 28. Bone. 2008. PMID: 18158281 Free PMC article.
-
Identification of a quantitative trait locus on rat chromosome 4 that is strongly linked to femoral neck structure and strength.Bone. 2006 Jul;39(1):93-9. doi: 10.1016/j.bone.2005.12.009. Epub 2006 Feb 3. Bone. 2006. PMID: 16461031
Cited by
-
Discovery of exercise-related genes and pathway analysis based on comparative genomes of Mongolian originated Abaga and Wushen horse.Open Life Sci. 2022 Sep 26;17(1):1269-1281. doi: 10.1515/biol-2022-0487. eCollection 2022. Open Life Sci. 2022. PMID: 36249530 Free PMC article.
-
Genetic regulation of bone strength: a review of animal model studies.Bonekey Rep. 2015 Jul 8;4:714. doi: 10.1038/bonekey.2015.83. eCollection 2015. Bonekey Rep. 2015. PMID: 26157577 Free PMC article. Review.
-
Integrative genomics identifies molecular alterations that challenge the linear model of melanoma progression.Cancer Res. 2011 Apr 1;71(7):2561-71. doi: 10.1158/0008-5472.CAN-10-2958. Epub 2011 Feb 22. Cancer Res. 2011. PMID: 21343389 Free PMC article.
-
GRASP55 restricts early-stage autophagy and regulates spatial organization of the early secretory network.Biol Open. 2021 Oct 15;10(10):bio058736. doi: 10.1242/bio.058736. Epub 2021 Oct 12. Biol Open. 2021. PMID: 34533192 Free PMC article.
-
Perforin-2/Mpeg1 and other pore-forming proteins throughout evolution.J Leukoc Biol. 2015 Nov;98(5):761-8. doi: 10.1189/jlb.4MR1114-523RR. Epub 2015 Aug 25. J Leukoc Biol. 2015. PMID: 26307549 Free PMC article. Review.
References
-
- Kanis JA, Melton LJ, Christiansen C, Johnston CC, Khaltaev N. The diagnosis of osteoporosis. J. Bone. Miner. Res. 1994;9:1137–1141. - PubMed
-
- Cummings SR, Black DM, Nevitt MC, Browner W, Cauley J, Ensrud K, Genant HK, Palermo L, Scott J, Vogt TM. Bone density at various sites for prediction of hip fractures, The Study of Osteoporotic Fractures Research Group. Lancet. 1993;341:72–75. - PubMed
-
- Faulkner KG, Cummings SR, Black D, Palermo L, Gluer CC, Genant HK. Simple measurement of femoral geometry predicts hip fracture: the study of osteoporotic fractures. J. Bone. Miner. Res. 1993;8:1211–1217. - PubMed
-
- Peacock M, Turner CH, Liu G, Manatunga AK, Timmerman L, Johnston CC. Better discrimination of hip fracture using bone density, geometry and architecture. Osteoporos. Int. 1995;5:167–173. - PubMed
-
- Arden NK, Baker J, Hogg C, Bann K, Spector TD. The heritability of bone mineral density, ultrasound of the calcaneus and hip axis length: a study of postmenopausal twins. J. Bone Miner. Res. 1996;11:530–534. - PubMed
Publication types
MeSH terms
Substances
Grants and funding
LinkOut - more resources
Full Text Sources
Molecular Biology Databases
Miscellaneous
