. 2009 Jun 2;15(6):527-38.
doi: 10.1016/j.ccr.2009.04.010.

Tumor vasculature is regulated by PHD2-mediated angiogenesis and bone marrow-derived cell recruitment

Affiliations

Tumor vasculature is regulated by PHD2-mediated angiogenesis and bone marrow-derived cell recruitment

Denise A Chan et al. Cancer Cell. .

Abstract

Sustained angiogenesis, through either local sprouting (angiogenesis) or the recruitment of bone marrow-derived cells (BMDCs) (vasculogenesis), is essential to the development of a tumor. How BMDCs are recruited to the tumor and their contribution to the tumor vasculature is poorly understood. Here, we demonstrate that both IL-8 and angiogenin contribute to the complementary pathways of angiogenesis and BMDC mobilization to increase tumor growth. These two factors are regulated by PHD2 in a HIF-independent but NF-kappaB-dependent manner. PHD2 levels are decreased in human cancers, compared with corresponding normal tissue, and correlate with an increase in mature blood vessels. Thus, PHD2 plays a critical role in regulating tumor angiogenesis.


Figures
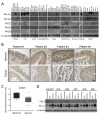
Figure 1
Figure 1
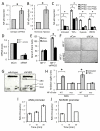
PHD2 Levels Decrease in Human Cancers (A) Variation of PHD2 levels in the NCI-60 panel of cell lines immunoblotted for PHD1, PHD2, PHD3, HIF-1α, HIF-2α, and α-tubulin. (B) Immunohistochemical staining for PHD2 in colon adenocarcinoma (bottom panels) compared to corresponding normal adjacent colon tissue (top panels) from several different patients. Scale bar = 500 μm. (C) Oncomine database analysis to examine PHD2 mRNA expression levels in adjacent, non-tumoral colon versus colon carcinoma (p<0.0005). (D) HCT116 cells with shRNA designed to specifically target PHD2. Cells were treated with DFO (100 μM; 4 hours) or proteasome inhibitor (MG132: 10 μM; 4 hours) and harvested to examine protein levels of PHD2, HIF-1α, and α-tubulin.
Figure 2
Figure 2
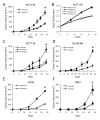
Loss of PHD2 Increases Tumor Growth (A) In vivo growth of wild-type or PHD2 knockdown (Construct A) HCT116 xenograft tumors (*p<0.00001). (B) In vitro growth curve of HCT116 cells with or without stable knockdown to PHD2 under either normoxic (N, 21% O2) or hypoxic (H, 2% O2) conditions. (C) Growth of wild-type or PHD2 knockdown (construct C or E) HCT116 tumors in mice (*p<0.001). (D) Growth of wild-type SU.86.86 or cells expressing PHD2 shRNA in SCID mice (*p<0.000005). (E) In vivo growth of HT29 cells expressing shRNA to PHD2 (Construct A) or control (construct E)(*p<0.000005). (F) Growth of wild-type RKO cells or cells expressing shRNA to PHD2 in SCID mice (*p<0.05). All error bars represent ±SEM.
Figure 3
Figure 3
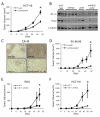
HIF-Independent Tumor Suppressor Function of PHD2 (A) Tumor growth of HCT116 cells expressing shRNA to HIF-1α alone or in combination with shRNA to PHD2 (*p<0.05). (B) PHD2 and HIF-1α silencing is maintained in vivo. Protein extracts from tumors in Figure 3A were immunoblotted to examine levels of HIF-1α, PHD2, and α-tubulin. (C) Tumor sections of the given genotype were stained for CA-IX expression. Scale bar = 200 μm. (D) Tumor growth of SU.86.86 cells with shRNA to PHD2 or shRNA to PHD2 and HIF-1β (*p<0.05). (E) In vivo growth of RKO cells deficient in HIF-1α or HIF-1α-deficient cells expressing PHD2 shRNA (*p<0.05). (F) In vivo growth of HIF-1α-deficient HCT116 cells or those expressing PHD2 shRNA (p<0.05). All error bars represent ±SEM.
Figure 4
Figure 4
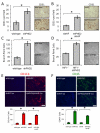
PHD2 Regulates Angiogenesis and Recruitment of Bone Marrow-Derived Cells (A) CD31 staining in sections from HCT116 tumors expressing PHD2 shRNA compared to wild-type tumors (*p<0.01). Scale bar = 500 μm. (B) CD31 staining in sections from HCT116 tumors expressing shRNA to both PHD2 and HIF-1α compared to those expressing HIF-1α shRNA alone (*p<0.0005). Scale bar = 500 μm. (C) In vitro tube formation of endothelial cells in conditioned media from wild-type HCT116 cells or cells expressing PHD2 (*p<0.000005). Scale bar = 1 mm. (D) In vitro tube formation of endothelial cells in conditioned media from HIF-1α-deficient HCT116 or HIF-1α-deficient HCT116 cells expressing PHD2 shRNA (*p<0.00005). Scale bar = 1 mm. (E) Staining of HCT116 tumors for bone marrow-derived myelomonocytic cells with CD11b (red) and nuclei with DAPI (blue) (*p<0.005). Scale bar = 100 μm. (F) HCT116 tumor staining for CD45 (green) and nuclei with DAPI (blue) (*p<0.005). Scale bar = 100 μm. All error bars represent ±SEM.
Figure 5
Figure 5
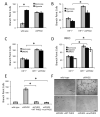
Hydroxylase function of PHD2 is not necessary for regulating angiogenesis (A) The ability of conditioned media from wild-type or PHD2 shRNA expressing HCT116 cells with or without hypoxia condition (2% O2, 16 hours) in inducing in vitro tube formation (*p<0.001). (B) The ability of conditioned media from HIF1-/- HCT116 cells or HIF1-/- HCT116 cells expressing PHD2 shRNA under normoxia or hypoxia (2% O2, 16 hours) in inducing in vitro tube formation (*p<0.01). (C) Conditioned media from HCT116 HIF1-/- cells or cells expressing shRNA to PHD2 treated with DMOG (1 mM, 16 hours) was subjected to in vitro tube formation (*p<0.001). (D) In vitro tube formation of conditioned media from RKO HIF1-/- cells or cells expressing shRNA to PHD2 treated with hypoxia (2% O2) or DMOG (1 mM) for 16 hours (*p<0.01). (E) HCT116 cells expressing PHD2 shRNA were transfected with either wild-type PHD2 or hydroxylase mutant PHD2 (H313A H315D). Conditioned media from these cells were collected and subjected to a tube formation assay (*p<0.001). All error bars represent ±SEM. (F) Representative photographs of primary endothelial cells seeded onto Matrigel in conditioned media from HCT116 cells stably expressing shRNA to PHD2 and transfected with either wild-type PHD2 or a hydroxylase mutant PHD2. Scale bar = 2 mm.
Figure 6
Figure 6
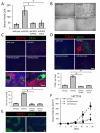
NF-κB regulates PHD2-mediated angiogenesis (A) NF-κB reporter assay of wild-type or HCT116 cells expressing PHD2 shRNA (*p<0.05). (B) NF-κB is hypoxia-responsive. HCT116 cells were transfected with a NF-κB luciferase reporter and treated with hypoxia (2% O2, 16 hours)(*p<0.005). (C) Wild-type or hydroxylase mutant PHD2 were overexpressed along with a NF-κB luciferase reporter construct in HCT116 HIF-1-/- cells stably expressing shRNA to PHD2. Following transfection, these cells were not treated or treated with TNF-α (20 ng/ml; 6 hours), hypoxia (2% O2; 16 hours), or DMOG (1 mM; 16 hours) (*p<0.05). (D) Quantitative real-time PCR to demonstrate knockdown of RELA in HCT116 cells with HIF-1α knocked out. (E) Conditioned media from HCT116 HIF-1-/- cells expressing PHD2 shRNA transfected with pool of non-targeting siRNA or siRNA targeting RELA were subjected to a tube formation assay (*p<0.0005). (F) Primary endothelial cells were seeded onto Matrigel in conditioned media from HIF-1α knockout cells or those expressing shRNA to PHD2 and assayed for tube formation. Scale bar = 1 mm. (G) Angiogenesis antibody arrays were carried out in duplicate with conditioned media from either wild-type HCT116 or cells stably expressing PHD2 shRNA. (H) Reporter assays with ANG or IL-8 promoters along with the promoters with mutant NF-κB sites. Two days after transfection, cells were treated with TNF-α (20 ng/ml; 6-8 hours) and luciferase activity was determined. (*p<0.005). (I, J) RELA is recruited to the ANG promoter. HCT116 cells expressing shRNA to PHD2 were treated with TNF-α (20 ng/ml) for the given amount of time. ChIP with α-RELA antibodies was performed, and RELA occupancy is shown. MnSOD promoter is used as a positive control for recruitment of RELA to a NF-κB target promoter. IgG control ChIPs were also performed as a negative control. All error bars represent ±SEM.
Figure 7
Figure 7
PHD2 Regulation of ANG and IL-8 Mediates Tumor Vasculature (A) Conditioned media from HCT116 cells expressing PHD2 shRNA and shRNA targeting either ANG or IL-8 were subjected to a tube formation assay (*p<0.05). (B) Tube formation with conditioned media from the given genotype. Scale bar = 2 mm. (C) Tumor staining for CD11b myelomonocytic precursor cells (red) and pericytes with vascular smooth muscle actin (green). Scale bar = 100 microns. Bottom panels are higher magnification of PHD2-silenced tumors. Scale bar = 500 microns. Quantification of CD11b-positive cells (*p<0.001). (D) Tumor staining for CD45 (red), hypoxia with pimonidazole (green) and nuclei with DAPI (blue). Scale bar = 100 microns. Quantification of CD45-positive cells (*p<0.001). (E) Higher magnification images of wild-type HCT116 tumors stained for CD31 (red) and pimonidazole (green). Scale bar = 100 microns. (F) Tumor growth of cells expressing the given shRNA in SCID mice (*p<0.005). All error bars represent ±SEM.
Figure 8
Figure 8
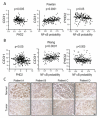
Decreased PHD2 Expression Correlates with Increases in NF-κB Activity and Tumor Angiogenesis in Human Cancers (A, B) Left panels: Significant negative correlation between the expression level of PHD2 (x-axis) and CD31 (y-axis) in the breast cancer samples profiled in two expression studies of breast cancers. Middle panels: Significant positive correlation between NF-κB pathway activity (x-axis) and expression of CD31 (y-axis). Right panels: Significant negative correlation between the expression level of PHD2 (x-axis) and NF-κB activity (y-axis). (C) Immunohistochemical staining for PHD2 in invasive breast carcinomas (bottom panels) compared to matched, uninvolved, adjacent breast tissue (top panels) from several different patients. Scale bar = 100 μm.

Similar articles

Cited by

References

    1. Appelhoff RJ, Tian YM, Raval RR, Turley H, Harris AL, Pugh CW, Ratcliffe PJ, Gleadle JM. Differential function of the prolyl hydroxylases PHD1, PHD2, and PHD3 in the regulation of hypoxia-inducible factor. J Biol Chem. 2004;279:38458–38465. - PubMed
    1. Berra E, Benizri E, Ginouves A, Volmat V, Roux D, Pouyssegur J. HIF prolyl-hydroxylase 2 is the key oxygen sensor setting low steady-state levels of HIF-1alpha in normoxia. Embo J. 2003;22:4082–4090. - PMC - PubMed
    1. Bild AH, Yao G, Chang JT, Wang Q, Potti A, Chasse D, Joshi MB, Harpole D, Lancaster JM, Berchuck A, et al. Oncogenic pathway signatures in human cancers as a guide to targeted therapies. Nature. 2006;439:353–357. - PubMed
    1. Carmeliet P. Mechanisms of angiogenesis and arteriogenesis. Nat Med. 2000;6:389–395. - PubMed
    1. Chan DA, Sutphin PD, Yen SE, Giaccia AJ. Coordinate regulation of the oxygen-dependent degradation domains of hypoxia-inducible factor 1 alpha. Mol Cell Biol. 2005;25:6415–6426. - PMC - PubMed

Publication types

MeSH terms

Substances

LinkOut - more resources