

Neurotransmitter regulation of c-fos and vasopressin gene expression in the rat supraoptic nucleus
- PMID: 19463813
- PMCID: PMC2743145
- DOI: 10.1016/j.expneurol.2009.05.019
Neurotransmitter regulation of c-fos and vasopressin gene expression in the rat supraoptic nucleus
Abstract
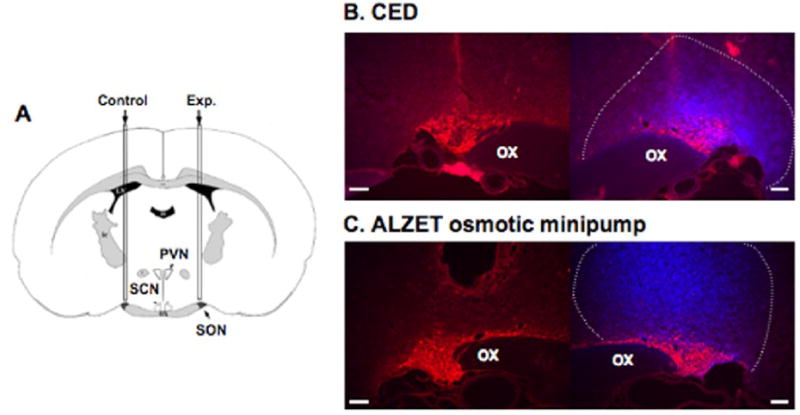
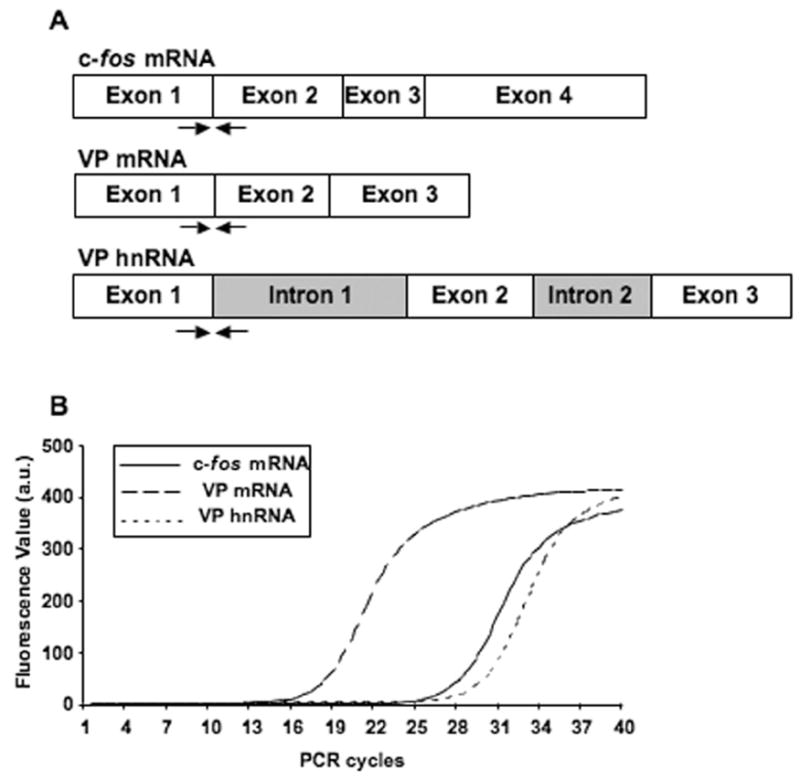
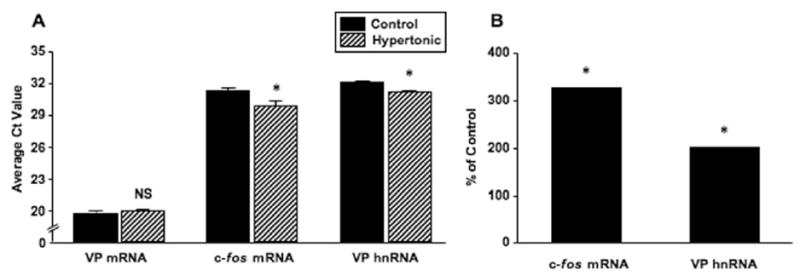
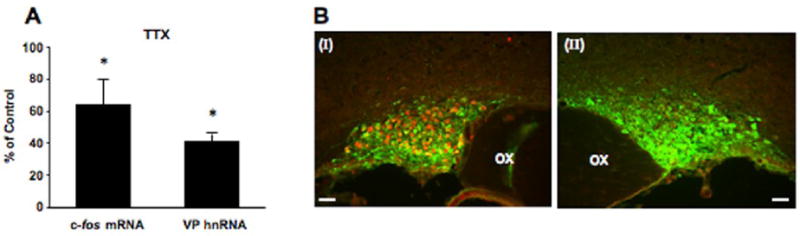
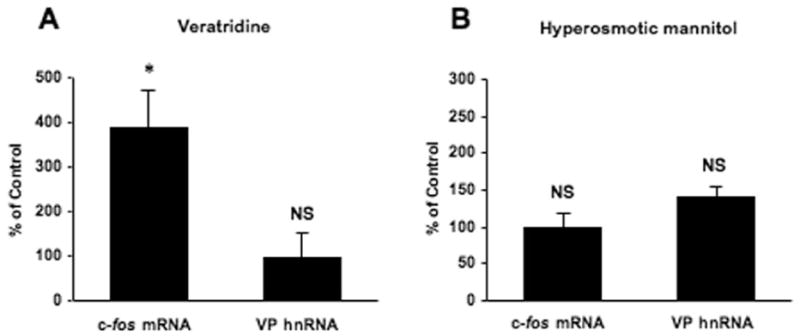
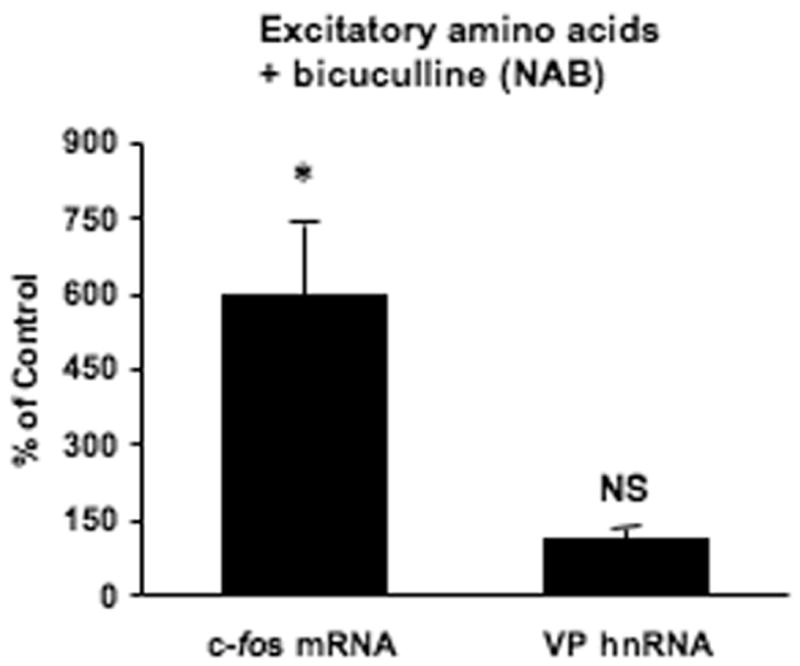
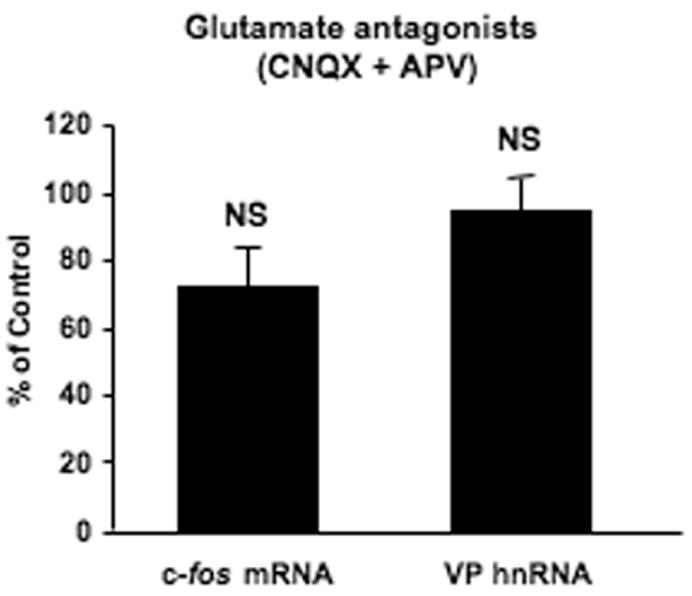
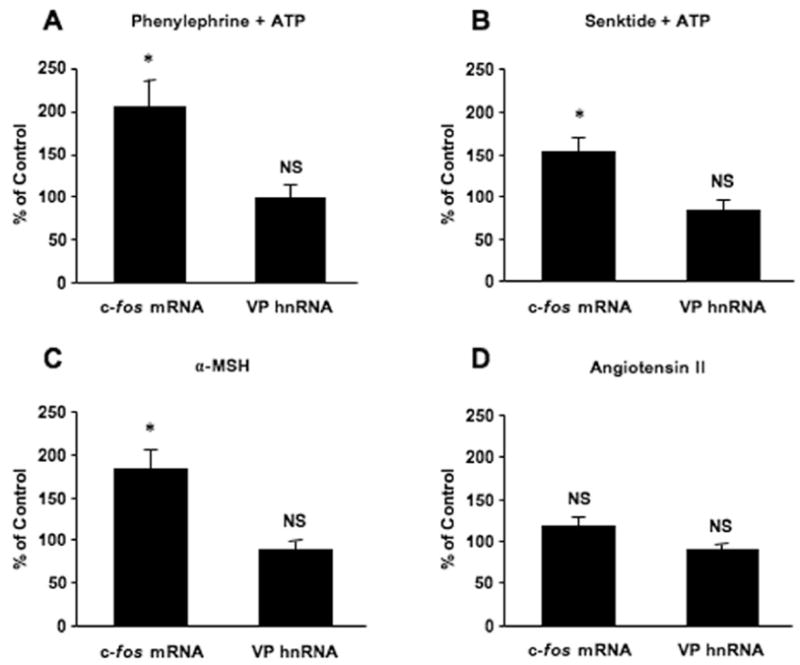
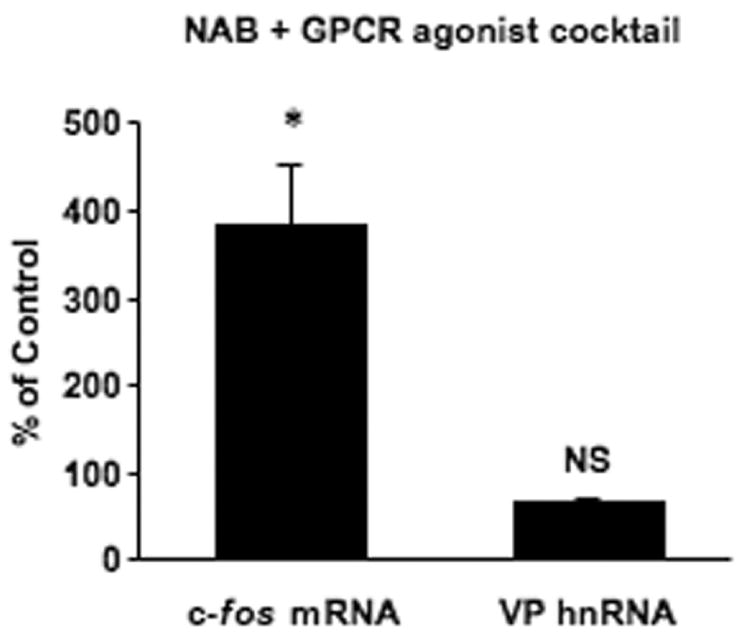
Acute increases in plasma osmotic pressure produced by intraperitoneal injection of hypertonic NaCl are sensed by osmoreceptors in the brain, which excite the magnocellular neurons (MCNs) in the supraoptic nucleus (SON) and the paraventricular nucleus (PVN) in the hypothalamus inducing the secretion of vasopressin (VP) into the general circulation. Such systemic osmotic stimulation also causes rapid and transient increases in the gene expression of c-fos and VP in the MCNs. In this study we evaluated potential signals that might be responsible for initiating these gene expression changes during acute hyperosmotic stimulation. We use an in vivo paradigm in which we stereotaxically deliver putative agonists and antagonists over the SON unilaterally, and use the contralateral SON in the same rat, exposed only to vehicle solutions, as the control SON. Quantitative real time-PCR was used to compare the levels of c-fos mRNA, and VP mRNA and VP heteronuclear (hn)RNA in the SON. We found that the ionotropic glutamate agonists (NMDA plus AMPA) caused an approximately 6-fold increase of c-fos gene expression in the SON, and some, but not all, G-coupled protein receptor agonists (e.g., phenylephrine, senktide, a NK-3-receptor agonist, and alpha-MSH) increased the c-fos gene expression in the SON from between 1.5 to 2-fold of the control SONs. However, none of these agonists were effective in increasing VP hnRNA as is seen with acute salt-loading. This indicates that the stimulus-transcription coupling mechanisms that underlie the c-fos and VP transcription increases during acute osmotic stimulation differ significantly from one another.
Figures
Similar articles
-
Expression of immediate early genes and vasopressin heteronuclear RNA in the paraventricular and supraoptic nuclei of rats after acute osmotic stimulus.J Neuroendocrinol. 2005 Apr;17(4):227-37. doi: 10.1111/j.1365-2826.2005.01297.x. J Neuroendocrinol. 2005. PMID: 15842234
-
Exaggerated response of a vasopressin-enhanced green fluorescent protein transgene to nociceptive stimulation in the rat.J Neurosci. 2009 Oct 21;29(42):13182-9. doi: 10.1523/JNEUROSCI.2624-09.2009. J Neurosci. 2009. PMID: 19846706 Free PMC article.
-
Reciprocal pathway between medullary visceral zone and hypothalamic supraoptic nucleus or paraventricular nucleus involved in hyperosmotic regulation.Cell Biol Int. 2009 Apr;33(4):475-82. doi: 10.1016/j.cellbi.2008.07.024. Epub 2008 Aug 6. Cell Biol Int. 2009. PMID: 18723099
-
Dehydration induces Fos, but not increased vasopressin mRNA in the supraoptic nucleus of aged rats.Brain Res. 1994 Aug 1;652(2):207-15. doi: 10.1016/0006-8993(94)90229-1. Brain Res. 1994. PMID: 7953732
-
Peptides and transmitter enzymes in hypothalamic magnocellular neurons after administration of hyperosmotic stimuli: comparison between messenger RNA and peptide/protein levels.Cell Tissue Res. 1990 May;260(2):279-97. doi: 10.1007/BF00318631. Cell Tissue Res. 1990. PMID: 1694105
Cited by
-
Effects of Probiotic Supplementation on Short Chain Fatty Acids in the AppNL-G-F Mouse Model of Alzheimer's Disease.J Alzheimers Dis. 2020;76(3):1083-1102. doi: 10.3233/JAD-200436. J Alzheimers Dis. 2020. PMID: 32623399 Free PMC article.
-
ANG II receptor subtype 1a gene knockdown in the subfornical organ prevents increased drinking behavior in bile duct-ligated rats.Am J Physiol Regul Integr Comp Physiol. 2014 Sep 15;307(6):R597-607. doi: 10.1152/ajpregu.00163.2014. Epub 2014 Jul 9. Am J Physiol Regul Integr Comp Physiol. 2014. PMID: 25009217 Free PMC article.
-
Activation of tachykinin, neurokinin 3 receptors affects chromatin structure and gene expression by means of histone acetylation.Peptides. 2012 Dec;38(2):282-90. doi: 10.1016/j.peptides.2012.09.006. Epub 2012 Sep 15. Peptides. 2012. PMID: 22985858 Free PMC article.
-
Neurokinin B causes acute GnRH secretion and repression of GnRH transcription in GT1-7 GnRH neurons.Mol Endocrinol. 2013 Mar;27(3):437-54. doi: 10.1210/me.2012-1271. Epub 2013 Feb 7. Mol Endocrinol. 2013. PMID: 23393128 Free PMC article.
-
Anatomical Markers of Activity in Hypothalamic Neurons.Compr Physiol. 2020 Mar 12;10(2):549-575. doi: 10.1002/cphy.c170021. Compr Physiol. 2020. PMID: 32163202 Free PMC article. Review.
References
-
- Antunes-Rodrigues J, de Castro M, Elias LL, Valenca MM, McCann SM. Neuroendocrine control of body fluid metabolism. Physiol Rev. 2004;84:169–208. - PubMed
-
- Arima H, Kondo K, Kakiya S, Nagasaki H, Yokoi H, Yambe Y, Murase T, Iwasaki Y, Oiso Y. Rapid and sensitive vasopressin heteronuclear RNA responses to changes in plasma osmolality. J Neuroendocrinol. 1999;11:337–341. - PubMed
-
- Bisset GW, Chowdrey HS. Control of release of vasopressin by neuroendocrine reflexes. Q J Exp Physiol. 1988;73:811–872. - PubMed
Publication types
MeSH terms
Substances
Grants and funding
LinkOut - more resources
Full Text Sources
Medical
