

Renshaw cell recurrent inhibition improves physiological tremor by reducing corticomuscular coupling at 10 Hz
- PMID: 19458232
- PMCID: PMC2690978
- DOI: 10.1523/JNEUROSCI.0272-09.2009
Renshaw cell recurrent inhibition improves physiological tremor by reducing corticomuscular coupling at 10 Hz
Abstract
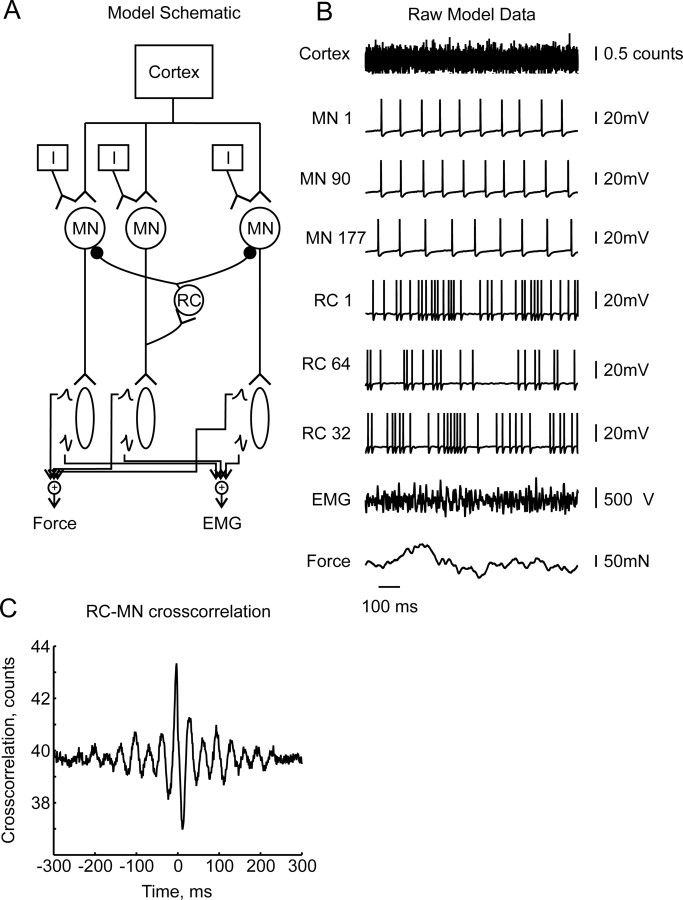
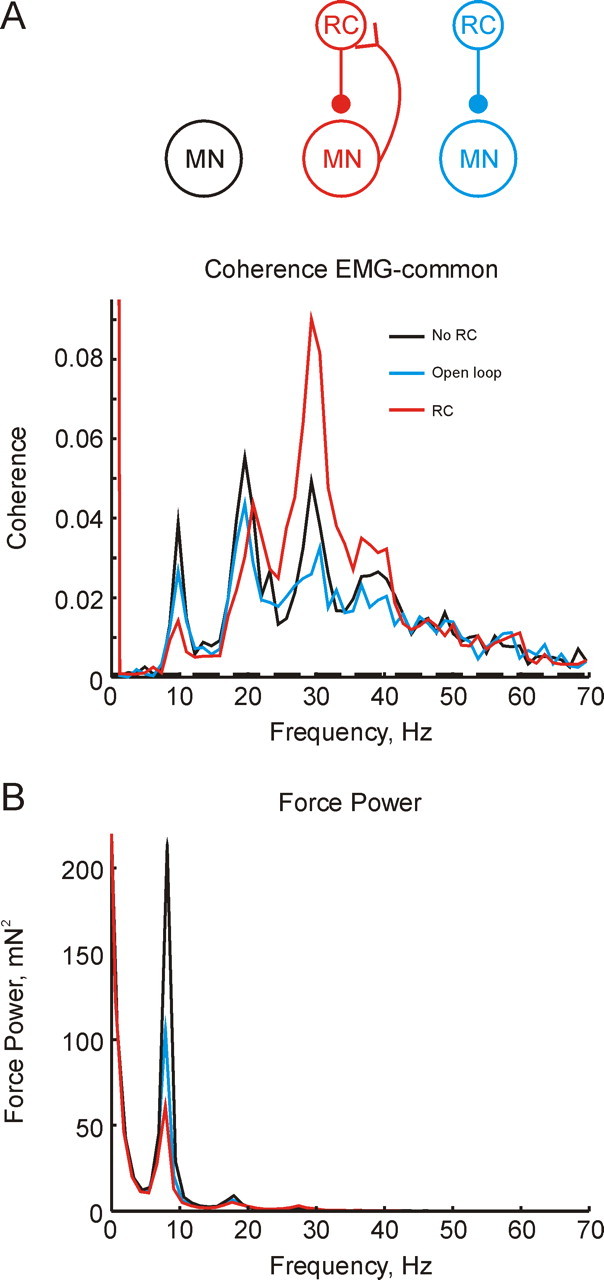
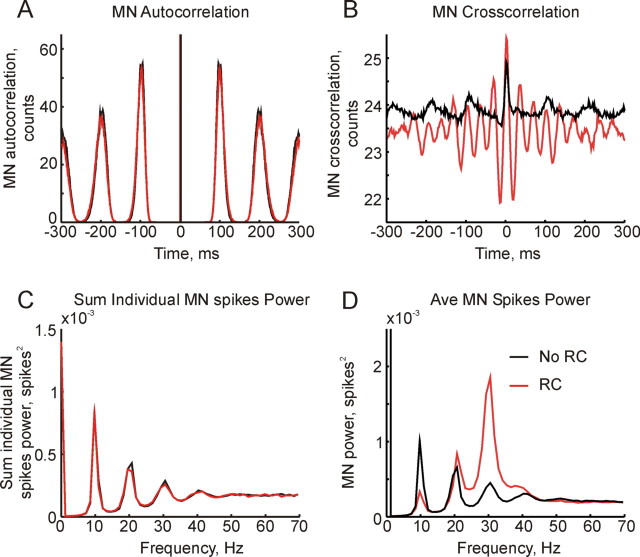
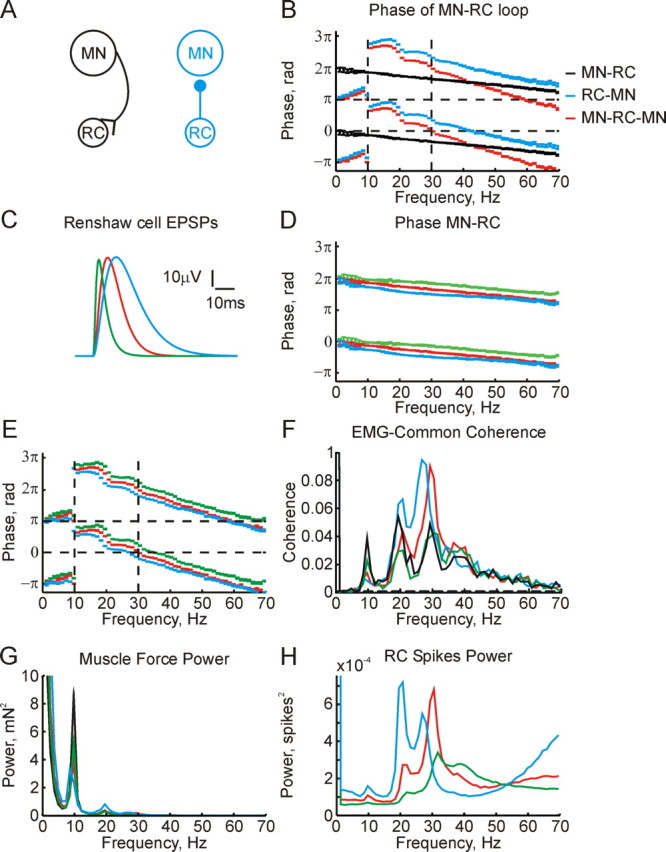
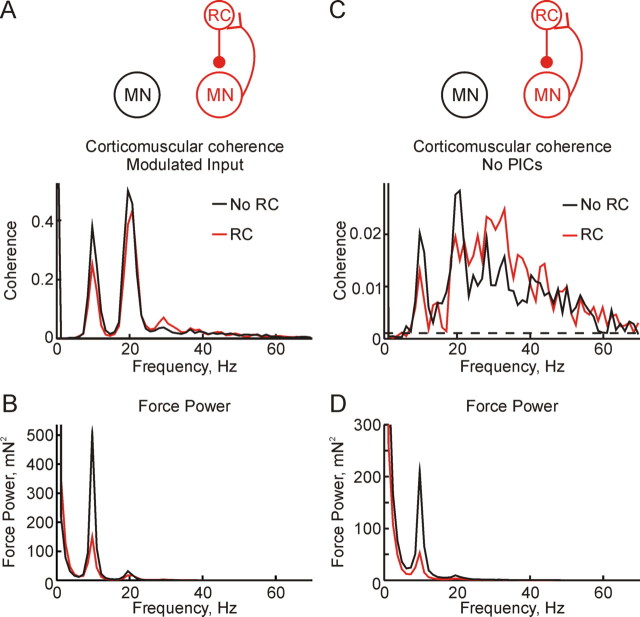
Corticomuscular coherence between the primary motor cortex (M1) and hand muscle electromyograms (EMG) occurs at approximately 20 Hz but is rarely seen at approximately 10 Hz. This is unexpected, because M1 has oscillations at both frequencies, which are effectively transmitted to the spinal cord via the corticospinal tract. We have previously speculated that a specific "neural filter" may selectively reduce coherence at approximately 10 Hz. This would have functional utility in minimizing physiological tremor, which often has a dominant component around this frequency. Recurrent inhibition via Renshaw cells in the spinal cord is a putative neural substrate for such a filter. Here we investigate this system in more detail with a biophysically based computational model. Renshaw cell recurrent inhibition reduced EMG oscillations at approximately 10 Hz, and also reduced corticomuscular coherence at this frequency (from 0.038 to 0.014). Renshaw cell inhibitory feedback also generated synchronous oscillations in the motoneuron pool at approximately 30 Hz. We show that the effects at 10 Hz and 30 Hz can both be understood from the dynamics of the inhibitory feedback loop. We conclude that recurrent inhibition certainly plays an important role in reducing 10 Hz oscillations in muscle, thereby decreasing tremor amplitude. However, our quantitative results suggest it is unlikely to be the only system for tremor reduction, and probably acts in concert with other neural circuits which remain to be elucidated.
Figures
Similar articles
-
Decorrelating actions of Renshaw interneurons on the firing of spinal motoneurons within a motor nucleus: a simulation study.J Neurophysiol. 1998 Jul;80(1):309-23. doi: 10.1152/jn.1998.80.1.309. J Neurophysiol. 1998. PMID: 9658052
-
Circuits generating corticomuscular coherence investigated using a biophysically based computational model. I. Descending systems.J Neurophysiol. 2009 Jan;101(1):31-41. doi: 10.1152/jn.90362.2008. Epub 2008 Nov 19. J Neurophysiol. 2009. PMID: 19019981 Free PMC article.
-
Spatial and Temporal Arrangement of Recurrent Inhibition in the Primate Upper Limb.J Neurosci. 2021 Feb 17;41(7):1443-1454. doi: 10.1523/JNEUROSCI.1589-20.2020. Epub 2020 Dec 17. J Neurosci. 2021. PMID: 33334866 Free PMC article.
-
On the role of recurrent inhibitory feedback in motor control.Prog Neurobiol. 1996 Aug;49(6):517-87. doi: 10.1016/0301-0082(96)00023-8. Prog Neurobiol. 1996. PMID: 8912393 Review.
-
Principles of interneuron development learned from Renshaw cells and the motoneuron recurrent inhibitory circuit.Ann N Y Acad Sci. 2013 Mar;1279:22-31. doi: 10.1111/nyas.12084. Ann N Y Acad Sci. 2013. PMID: 23530999 Free PMC article. Review.
Cited by
-
Developmental tuning and decay in senescence of oscillations linking the corticospinal system.J Neurosci. 2010 Mar 10;30(10):3663-74. doi: 10.1523/JNEUROSCI.5621-09.2010. J Neurosci. 2010. PMID: 20220000 Free PMC article.
-
Pre-Synaptic Inhibition of Afferent Feedback in the Macaque Spinal Cord Does Not Modulate with Cycles of Peripheral Oscillations Around 10 Hz.Front Neural Circuits. 2015 Nov 18;9:76. doi: 10.3389/fncir.2015.00076. eCollection 2015. Front Neural Circuits. 2015. PMID: 26635536 Free PMC article.
-
Spasms after spinal cord injury show low-frequency intermuscular coherence.J Neurophysiol. 2018 Oct 1;120(4):1765-1771. doi: 10.1152/jn.00112.2018. Epub 2018 Aug 1. J Neurophysiol. 2018. PMID: 30067124 Free PMC article.
-
Alpha- and beta-band oscillations subserve different processes in reactive control of limb movements.Front Behav Neurosci. 2014 Nov 5;8:383. doi: 10.3389/fnbeh.2014.00383. eCollection 2014. Front Behav Neurosci. 2014. PMID: 25414649 Free PMC article.
-
Fast Oscillatory Commands from the Motor Cortex Can Be Decoded by the Spinal Cord for Force Control.J Neurosci. 2015 Oct 7;35(40):13687-97. doi: 10.1523/JNEUROSCI.1950-15.2015. J Neurosci. 2015. PMID: 26446221 Free PMC article.
References
-
- Adam D, Windhorst U, Inbar GF. The effects of recurrent inhibition on the cross-correlated firing patterns of motoneurones (and their relation to signal transmission in the spinal cord-muscle channel) Biol Cybern. 1978;29:229–235. - PubMed
-
- Asanuma H, Zarzecki P, Jankowska E, Hongo T, Marcus S. Projection of individual pyramidal tract neurons to lumbar motor nuclei of the monkey. Exp Brain Res. 1979;34:73–89. - PubMed
-
- Baker SN, Lemon RN. A computer simulation study of the production of post-spike facilitation in spike triggered averages of rectified EMG. J Neurophysiol. 1998;80:1391–1406. - PubMed
Publication types
MeSH terms
Grants and funding
LinkOut - more resources
Full Text Sources
Medical