Comparative Study
. 2009 Aug;137(2):691-703, 703.e1-6.
doi: 10.1053/j.gastro.2009.05.003. Epub 2009 May 13.

Aberrant cell cycle progression and endoreplication in regenerating livers of mice that lack a single E-type cyclin

Affiliations
Comparative Study

Aberrant cell cycle progression and endoreplication in regenerating livers of mice that lack a single E-type cyclin

Yulia A Nevzorova et al. Gastroenterology. 2009 Aug.

Abstract

Background & aims: E-cyclins control the transition of quiescent cells into the cell cycle. Two E-cyclins, CcnE1 and CcnE2, have been described, but their specific contributions to cell cycle reentry in vivo are poorly understood. Liver regeneration following partial hepatectomy is an excellent in vivo model for the study of cell cycle reentry of quiescent cells. We investigated the relevance of E-cyclins in directing resting hepatocytes into the cell cycle after partial hepatectomy using CcnE1 and CcnE2 knockout mice.

Methods: Partial hepatectomy (70%) was performed in CcnE1 (E1(-/-)) and CcnE2 (E2(-/-)) knockout and wild-type mice. Liver regeneration was monitored by cell cycle markers for G(1)/S phase, S phase, and M phase as well as by determining the liver/body weight ratio after partial hepatectomy. Ploidy of hepatocytes was determined by fluorescence-activated cell sorting and fluorescent in situ hybridization.

Results: CcnE1 deletion resulted in normal liver regeneration with a slight delay of the G(1)/S-phase transition and a defect in endoreplication of otherwise polyploid hepatocytes. Surprisingly, E2(-/-) mice displayed accelerated and sustained DNA synthesis after partial hepatectomy, excessive endoreplication in hepatocytes, and a liver mass that was 45% greater than that of wild-type mice after termination of the regeneration process. CcnE2 depletion induced overexpression of CcnE1 and prolonged cdk2 kinase activity after partial hepatectomy.

Conclusions: CcnE2 has an unexpected role in repressing CcnE1; the phenotype of E2(-/-) mice appears to result from CcnE1 overexpression and cdk2 hyperactivation. CcnE1 and CcnE2 therefore have nonredundant functions for S-phase entry and endoreplication during liver regeneration.


Conflict of interest statement

The authors report no financial conflicts of interest

Figures
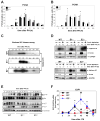
Figure 1
Figure 1
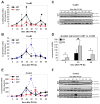
Aberrant G1/S phase transition in E1-/- and E2-/- mice. WT, E1-/- and E2-/- mice were subjected to PH and the remnant livers were analyzed at indicated time points. (A-B) G1/S phase was analyzed by nuclear PCNA staining in liver tissues of (A) WT compared to E1-/- hepatocytes or (B) WT compared to E2-/- hepatocytes. Each value represents the mean of 5-10 mice. (C) Determination of cdk2 kinase activity. Native cdk2 kinase complexes from mouse livers of WT, E1-/- and E2-/- mice after PH were subjected to in vitro histone H1 kinase assays. Representative data from three independent experiments is shown. (D) Protein extracts from WT, E1-/- and E2-/- mice after PH were depleted for CcnA/cdk2 complexes by immunoprecipitation with an anti-CcnA antibody where indicated and subjected to histone H1 kinase assays in comparison to untreated extracts representing total cdk2 activity. Depletion of CcnA was verified by CcnA western blot of the same lysates; GAPDH expression is shown as input control. (E) Whole liver cell extracts were investigated for RB phosphorylation and expression of cell cycle inhibitors p27 and p21, respectively. Two distinct signals for phospho-RB representing phosphorylated and hyper-phosphorylated RB were detected and highlighted by arrows. The expression levels of total RB and GAPDH are presented as internal loading controls. (F) Kinetics of E2F1 gene expression 0-72 h post PH measured by quantitative real-time PCR. The average of five independent experiments is shown. (*) p < 0.01; (#) p < 0.05.
Figure 2
Figure 2
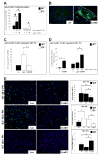
Altered cell cycle progression in E1-/- and E2-/- mice is associated with modified expression profiles of E - and A-cyclins. (A-B) Relative real-time-PCR analysis of (A) CcnE2 in E1-/- mice and WT controls and (B) CcnE1 in E2-/- - and WT mice. (C) Western blot analysis for CcnE1 from WT, E1-/- and E2-/- mice at indicated time points after PH. (D) Absolute measurement of CcnE1 and E2 mRNA level in WT mice showing overall exceeding CcnE2 over CcnE1 expression. (E) Analysis of CcnA2 gene expression in WT, E1-/- and E2-/- mice by real-time PCR. (F) Western blot analysis of CcnA2 expression in E1-/-, E2-/- and WT control mice at indicated time points after PH. (*) p < 0.01; (#) p < 0.05.
Figure 3
Figure 3
Ectopic over-expression of CcnE2 inhibits S-phase progression in hepatocytes after PH. E2-/- and WT mice were transduced with adv-CcnE2, adv-CcnE1 or adv-Luc adenovirus. 24 h after infection, the animals were subjected to PH and sacrificed at time points indicated. (A) Quantitative measurement of CcnE2 cDNA in WT – and E2-/- mice following adv-CcnE2 transduction and PH. CcnE2 gene expression was calculated as number of molecules/106 GAPDH. (B) Determination of adv-CcnE2 transduction efficiency. Liver cryosections of non-transduced (ctrl) or adv-CcnE2 injected (CcnE2) WT mice 48 h after PH were stained with an antibody directed against the adenoviral E1A protein (green). The area of maximal virus transduction around portal venules is highlighted. (C) Absolute measurement of CcnE1 in E2-/- livers 48 h after PH. Mice were either transduced with luciferase control (Luc) or CcnE2 (CcnE2) adenovirus before hepatectomy. The CcnE1 expression of WT animals (black bar) is indicated as a reference. (D) WT mice were transduced with adv-CcnE1 (CcnE1) or adv-Luc (Luc) where indicated. CcnE1 cDNA was measured before – and 36 h after PH. (E) Determination of BrdU incorporation following adenoviral over-expression of CcnE2 in WT - and E2-/- mice (green staining) or CcnE1 in WT animals (red staining) for time points post PH as indicated. Total nuclei are stained in blue with DAPI. As control, animals were transduced with adv-Luc (Luc). For each group a minimum of three animals was analyzed and quantitative data of five cryosections per animal is shown in the right part of the panel. (*) p < 0.01; (#) p < 0.05.
Figure 4
Figure 4
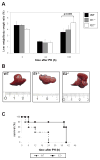
Pathophysiological effects of CcnE2 depletion. (A-B) CcnE2 ablation results in hepatomegaly after PH. (A) Liver weight index (%) at indicated time points after PH. (B) Representative livers from WT, E1-/- and E2-/- mice 168 h after PH. (C) Depletion of CcnE2 provides improved survival after 90% hepatectomy. Kaplan-Meyer survival curve shows time-dependent survival of WT mice (broken line, n=5) and E2-/- mice (solid line, n=5).
Figure 5
Figure 5
Analysis of M-phase progression in E1-/- and E2-/- mice. (A-C) Liver cryosections from WT, E1-/- and E2-/- mice after PH were analysed for phosphorylation of histone H3. (A) Representative images at relevant time points are shown. Total nuclei are counterstained with DAPI (blue); green nuclei indicate H3 phosphorylation. (B-C) Percentage of histone H3-positive nuclei in liver sections from (B) WT and E1-/- mice and (C) WT and E2-/- mice. Each value represents the mean of 5-10 animals. (*) p < 0.01; (#) p < 0.05. (D) CcnB1 mRNA expression in response to PH at indicated time points in E1-/-, E2-/- and WT mice. (E) CcnB1 protein expression in E1-/-, E2-/- and WT mice between 0 h and 168 h after PH.
Figure 6
Figure 6
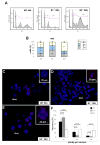
Antagonistic roles of CcnE1 and CcnE2 for endoreplication in hepatocytes. (A-B) Primary hepatocytes from E1-/-, E2-/- and WT mice were isolated 96 h after PH. DNA content of propidium iodide (PI) stained hepatocytes was determined by FACS analysis. (A) Representative FACS histograms for WT, E1-/- and E2-/- hepatocytes. X-axis: PI intensity; Y-axis: cell number. (B) Distribution of diploid (2n), tetraploid (4n) and hyperploid (>4n) hepatocytes. (C-F) Mice were subjected to PH. 96 h after surgery primary hepatocytes were isolated and probed for the Y chromosome (red signals). (C) WT hepatocytes. (D) E1-/- hepatocytes. (E) E2-/- hepatocytes. (F) For each group, a minimum of 1000 nuclei were analyzed for the number of Y chromosomes. The data was calculated as the percentage of 2n, 4n and >4n nuclei per population.
Figure 7
Figure 7
Model explaining the phenotype of E2-/- mice as the result of stronger CcnE1 activation. Left: In quiescent WT livers, CcnE2 molecules are in excess over CcnE1 and CcnE2 competes with CcnE1 for binding to cdk2, whereas the kinase activity of CcnE2/cdk2 is lower compared to the CcnE1/cdk2 kinase leading to a balanced phosphorylation of S-phase related substrates such as RB. Moreover, CcnE1 - but not CcnE2, controls moderate endoreplication of the regenerating hepatocyte. Right: In E2-/- mice, total CcnE/cdk2 kinase activity is stronger and solely mediated via CcnE1 leading to earlier and stronger RB- and histone H1 phosphorylation. This may also result in prolonged kinase activity through an E2F-mediated feedback loop and excessive endoreplication.

References

    1. Kaldis P, Aleem E. Cell cycle sibling rivalry: Cdc2 vs. Cdk2. Cell Cycle. 2005;4:1491–4. - PubMed
    1. Geng Y, Yu Q, Sicinska E, et al. Cyclin E ablation in the mouse. Cell. 2003;114:431–43. - PubMed
    1. Gudas JM, Payton M, Thukral S, et al. Cyclin E2, a novel G1 cyclin that binds Cdk2 and is aberrantly expressed in human cancers. Mol Cell Biol. 1999;19:612–22. - PMC - PubMed
    1. Koff A, Cross F, Fisher A, et al. Human cyclin E, a new cyclin that interacts with two members of the CDC2 gene family. Cell. 1991;66:1217–28. - PubMed
    1. Lauper N, Beck AR, Cariou S, et al. Cyclin E2: a novel CDK2 partner in the late G1 and S phases of the mammalian cell cycle. Oncogene. 1998;17:2637–43. - PubMed

Publication types

MeSH terms