Zebrafish kidney stromal cell lines support multilineage hematopoiesis
- PMID: 19433857
- PMCID: PMC2714204
- DOI: 10.1182/blood-2009-02-203638
Zebrafish kidney stromal cell lines support multilineage hematopoiesis
Abstract
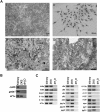
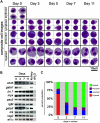
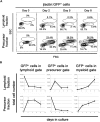
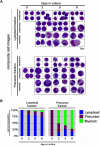
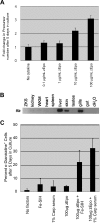
Studies of zebrafish hematopoiesis have been largely performed using mutagenesis approaches and retrospective analyses based upon gene expression patterns in whole embryos. We previously developed transplantation assays to test the repopulation potentials of candidate hematopoietic progenitor cells. We have been impaired, however, in determining cellular differentiation potentials by a lack of short-term functional assays. To enable more precise analyses of hematopoietic progenitor cells, we have created zebrafish kidney stromal (ZKS) cell lines. Culture of adult whole kidney marrow with ZKS cells results in the maintenance and expansion of hematopoietic precursor cells. Hematopoietic growth is dependent upon ZKS cells, and we show that ZKS cells express many growth factors and ligands previously demonstrated to be important in maintaining mammalian hematopoietic cells. In the absence of exogenous growth factors, ZKS cells maintain early hematopoietic precursors and support differentiation of lymphoid and myeloid cells. With the addition of zebrafish erythropoietin, ZKS cells also support the differentiation of erythroid precursors. These conditions have enabled the ability to ascertain more precisely the points at which hematopoietic mutants are defective. The development of robust in vitro assays now provide the means to track defined, functional outcomes for prospectively isolated blood cell subsets in the zebrafish.
Figures


Similar articles
-
Zebrafish embryonic stromal trunk (ZEST) cells support hematopoietic stem and progenitor cell (HSPC) proliferation, survival, and differentiation.Exp Hematol. 2015 Dec;43(12):1047-61. doi: 10.1016/j.exphem.2015.09.001. Epub 2015 Sep 21. Exp Hematol. 2015. PMID: 26391449 Free PMC article.
-
Clonal analysis of hematopoietic progenitor cells in the zebrafish.Blood. 2011 Aug 4;118(5):1274-82. doi: 10.1182/blood-2011-01-331199. Epub 2011 Mar 17. Blood. 2011. PMID: 21415264 Free PMC article.
-
Inhibition of Canonical Wnt Signaling Promotes Ex Vivo Maintenance and Proliferation of Hematopoietic Stem Cells in Zebrafish.Stem Cells. 2022 Sep 26;40(9):831-842. doi: 10.1093/stmcls/sxac044. Stem Cells. 2022. PMID: 35759948
-
Assaying hematopoiesis using zebrafish.Blood Cells Mol Dis. 2013 Dec;51(4):271-6. doi: 10.1016/j.bcmd.2013.07.009. Epub 2013 Aug 2. Blood Cells Mol Dis. 2013. PMID: 23916372 Free PMC article. Review.
-
Oceans of opportunity: exploring vertebrate hematopoiesis in zebrafish.Exp Hematol. 2014 Aug;42(8):684-96. doi: 10.1016/j.exphem.2014.05.002. Epub 2014 May 9. Exp Hematol. 2014. PMID: 24816275 Free PMC article. Review.
Cited by
-
Dissection of vertebrate hematopoiesis using zebrafish thrombopoietin.Blood. 2014 Jul 10;124(2):220-8. doi: 10.1182/blood-2014-03-564682. Epub 2014 May 28. Blood. 2014. PMID: 24869937 Free PMC article.
-
NHD2-15, a novel antagonist of Growth Factor Receptor-Bound Protein-2 (GRB2), inhibits leukemic proliferation.PLoS One. 2020 Aug 11;15(8):e0236839. doi: 10.1371/journal.pone.0236839. eCollection 2020. PLoS One. 2020. PMID: 32780746 Free PMC article.
-
The zebrafish granulocyte colony-stimulating factors (Gcsfs): 2 paralogous cytokines and their roles in hematopoietic development and maintenance.Blood. 2013 Dec 5;122(24):3918-28. doi: 10.1182/blood-2012-12-475392. Epub 2013 Oct 15. Blood. 2013. PMID: 24128862 Free PMC article.
-
Zebrafish embryonic stromal trunk (ZEST) cells support hematopoietic stem and progenitor cell (HSPC) proliferation, survival, and differentiation.Exp Hematol. 2015 Dec;43(12):1047-61. doi: 10.1016/j.exphem.2015.09.001. Epub 2015 Sep 21. Exp Hematol. 2015. PMID: 26391449 Free PMC article.
-
Wilms Tumor 1b Expression Defines a Pro-regenerative Macrophage Subtype and Is Required for Organ Regeneration in the Zebrafish.Cell Rep. 2019 Jul 30;28(5):1296-1306.e6. doi: 10.1016/j.celrep.2019.06.091. Cell Rep. 2019. PMID: 31365871 Free PMC article.
References
-
- McCulloch EA, Till JE. The radiation sensitivity of normal mouse bone marrow cells, determined by quantitative marrow transplantation into irradiated mice. Radiat Res. 1960;13:115–125. - PubMed
-
- Till JE, Mc CE. A direct measurement of the radiation sensitivity of normal mouse bone marrow cells. Radiat Res. 1961;14:213–222. - PubMed
-
- Ford CE, Hamerton JL, Barnes DW, Loutit JF. Cytological identification of radiation-chimaeras. Nature. 1956;177:452–454. - PubMed
-
- Bach FH, Albertini RJ, Joo P, Anderson JL, Bortin MM. Bone-marrow transplantation in a patient with the Wiskott-Aldrich syndrome. Lancet. 1968;2:1364–1366. - PubMed
-
- De Koning J, Van Bekkum DW, Dicke KA, Dooren LJ, Radl J, Van Rood JJ. Transplantation of bone-marrow cells and fetal thymus in an infant with lymphopenic immunological deficiency. Lancet. 1969;1:1223–1227. - PubMed
Publication types
MeSH terms
Substances
Grants and funding
LinkOut - more resources
Full Text Sources
Research Materials

