

Use of FTIR spectroscopic imaging to identify parameters associated with fragility fracture
- PMID: 19419303
- PMCID: PMC2730929
- DOI: 10.1359/jbmr.090414
Use of FTIR spectroscopic imaging to identify parameters associated with fragility fracture
Abstract
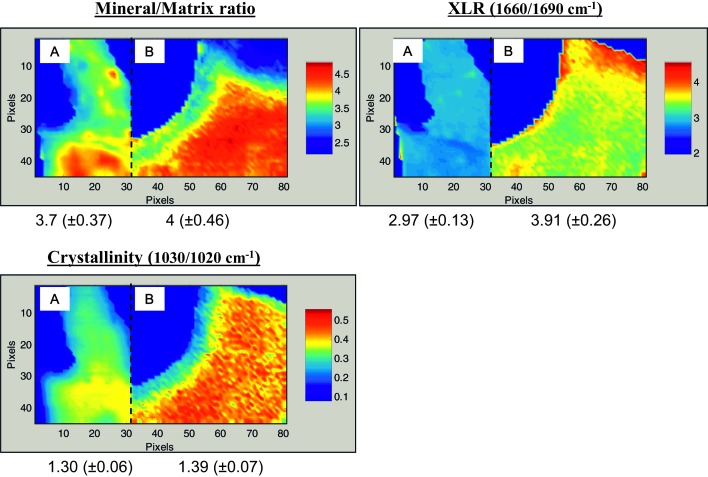
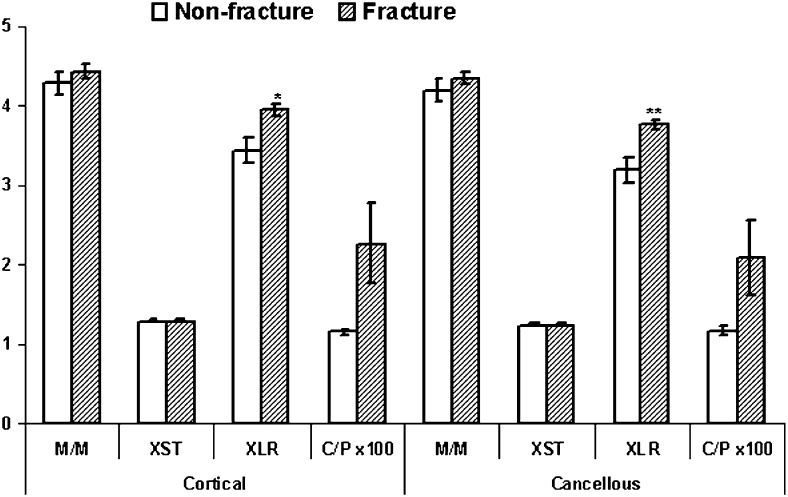
BMD does not entirely explain an individual's risk of fracture. The purpose of this study was to assess whether specific differences in spatially resolved bone composition also contribute to fracture risk. These differences were assessed using Fourier transform infrared spectroscopic imaging (FTIRI) and analyzed through multiple logistic regression. Models were constructed to determine whether FTIRI measured parameters describing mineral content, mineral crystal size and perfection, and collagen maturity were associated with fracture. Cortical and cancellous bone were independently evaluated in iliac crest biopsies from 54 women (32 with fractures, 22 without) who had significantly different spine but not hip BMDs and ranged in age from 30 to 83 yr. The parameters that were significantly associated with fracture in the model were cortical and cancellous collagen maturity (increased with increased fracture risk), cortical mineral/matrix ratio (higher with increased fracture risk), and cancellous crystallinity (increased with increased fracture risk). As expected, because of its correlation with cortical but not cancellous bone density, hip BMD was significantly associated with fracture risk in the cortical but not the cancellous model. This research suggests that additional parameters associated with fracture risk should be targeted for therapies for osteoporosis.
Figures
Similar articles
-
Examining the Relationships Between Bone Tissue Composition, Compositional Heterogeneity, and Fragility Fracture: A Matched Case-Controlled FTIRI Study.J Bone Miner Res. 2016 May;31(5):1070-81. doi: 10.1002/jbmr.2759. Epub 2015 Dec 24. J Bone Miner Res. 2016. PMID: 26636271 Free PMC article. Clinical Trial.
-
Fourier transform infrared imaging of femoral neck bone: reduced heterogeneity of mineral-to-matrix and carbonate-to-phosphate and more variable crystallinity in treatment-naive fracture cases compared with fracture-free controls.J Bone Miner Res. 2013 Jan;28(1):150-61. doi: 10.1002/jbmr.1724. J Bone Miner Res. 2013. PMID: 22865771 Free PMC article.
-
Evidence of altered matrix composition in iliac crest biopsies from patients with idiopathic juvenile osteoporosis.Connect Tissue Res. 2016;57(1):28-37. doi: 10.3109/03008207.2015.1088531. Epub 2015 Nov 5. Connect Tissue Res. 2016. PMID: 26539896 Free PMC article.
-
Contribution of bone mineral density and bone turnover markers to the estimation of risk of osteoporotic fracture in postmenopausal women.J Musculoskelet Neuronal Interact. 2004 Mar;4(1):50-63. J Musculoskelet Neuronal Interact. 2004. PMID: 15615078 Review.
-
Vibrational spectroscopic techniques to assess bone quality.Osteoporos Int. 2017 Aug;28(8):2275-2291. doi: 10.1007/s00198-017-4019-y. Epub 2017 Apr 5. Osteoporos Int. 2017. PMID: 28378291 Review.
Cited by
-
Aging and bone.J Dent Res. 2010 Dec;89(12):1333-48. doi: 10.1177/0022034510377791. Epub 2010 Oct 5. J Dent Res. 2010. PMID: 20924069 Free PMC article. Review.
-
Generalized Uncoupled Bone Remodeling Associated With Delayed Healing of Fatigue Fractures.JBMR Plus. 2022 Jan 19;6(3):e10598. doi: 10.1002/jbm4.10598. eCollection 2022 Mar. JBMR Plus. 2022. PMID: 35309868 Free PMC article.
-
Infrared assessment of bone quality: a review.Clin Orthop Relat Res. 2011 Aug;469(8):2170-8. doi: 10.1007/s11999-010-1751-4. Clin Orthop Relat Res. 2011. PMID: 21210314 Free PMC article. Review.
-
Handheld hyperspectral imaging as a tool for the post-mortem interval estimation of human skeletal remains.Heliyon. 2024 Feb 3;10(4):e25844. doi: 10.1016/j.heliyon.2024.e25844. eCollection 2024 Feb 29. Heliyon. 2024. PMID: 38375262 Free PMC article.
-
Preclinical Rodent Models for Human Bone Disease, Including a Focus on Cortical Bone.Endocr Rev. 2024 Jul 12;45(4):493-520. doi: 10.1210/endrev/bnae004. Endocr Rev. 2024. PMID: 38315213 Free PMC article. Review.
References
-
- World Health Organization. Geneva, Switzerland: World Health Organization; 2003. Prevention and Management of Osteoporosis.
-
- NIH Consensus Development Panel on Osteoporosis Prevention, Diagnosis, and Therapy. Osteoporosis prevention, diagnosis, and therapy. JAMA. 2001;285:785–795. - PubMed
-
- McCreadie BR, Goldstein SA. Biomechanics of fracture: Is bone mineral density sufficient to assess risk? J Bone Miner Res. 2000;15:2305–2308. - PubMed
-
- Perilli E, Baleani M, Ohman C, Fognani R, Baruffaldi F, Viceconti M. Dependence of mechanical compressive strength on local variations in microarchitecture in cancellous bone of proximal human femur. J Biomech. 2008;41:438–446. - PubMed
Publication types
MeSH terms
Grants and funding
LinkOut - more resources
Full Text Sources
Other Literature Sources
Medical
Research Materials
