. 2009 Jun 26;284(26):17883-96.
doi: 10.1074/jbc.M109.001842. Epub 2009 Apr 30.

Crystal structure of a fibroblast growth factor homologous factor (FHF) defines a conserved surface on FHFs for binding and modulation of voltage-gated sodium channels

Affiliations

Crystal structure of a fibroblast growth factor homologous factor (FHF) defines a conserved surface on FHFs for binding and modulation of voltage-gated sodium channels

Regina Goetz et al. J Biol Chem. .

Abstract

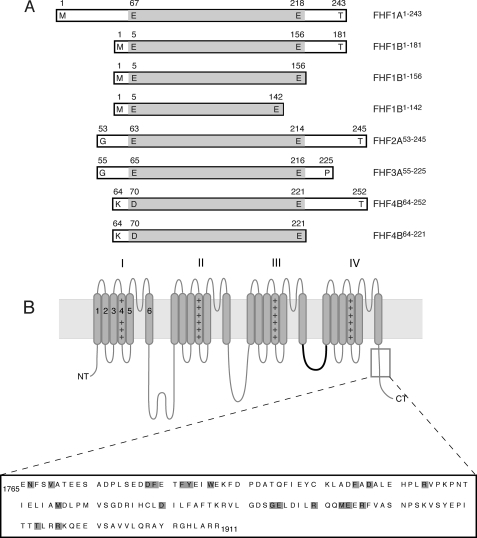
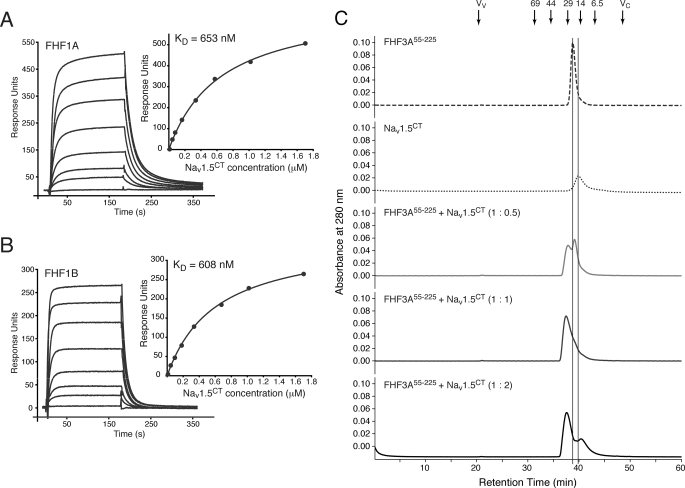
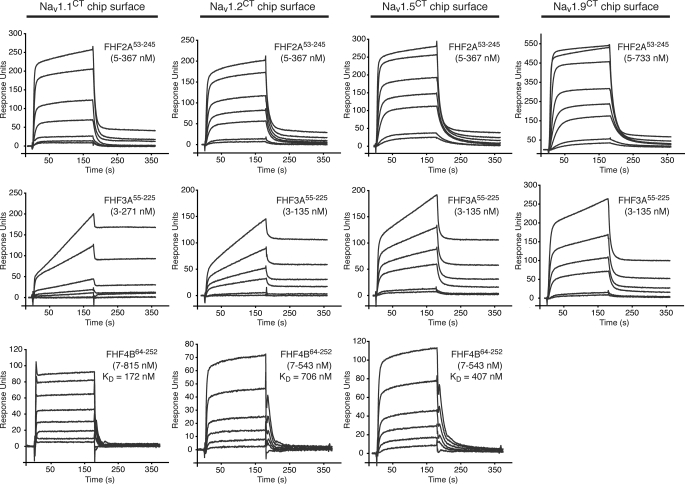
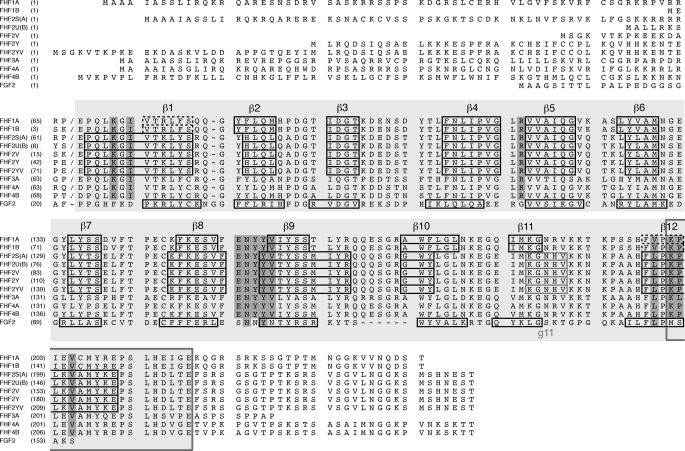
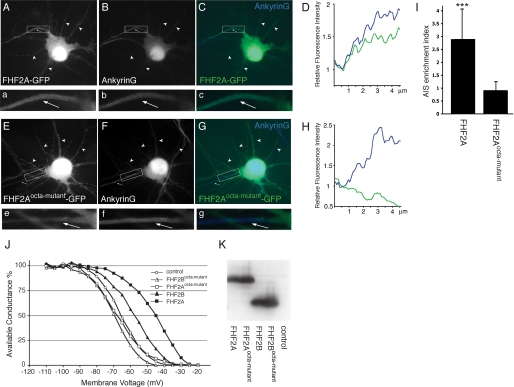
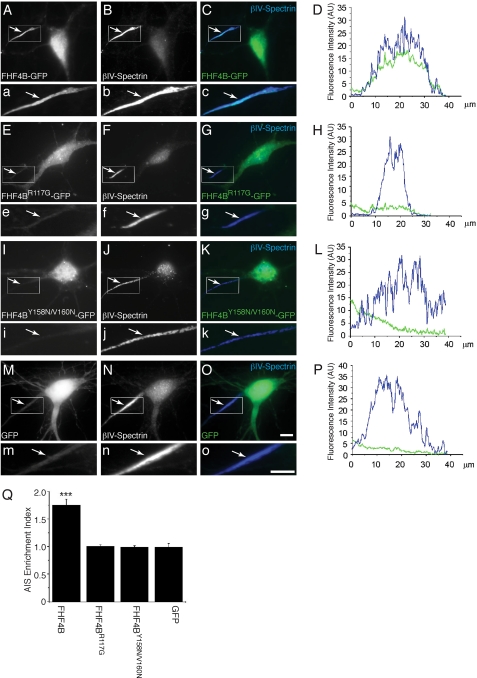
Voltage-gated sodium channels (Nav) produce sodium currents that underlie the initiation and propagation of action potentials in nerve and muscle cells. Fibroblast growth factor homologous factors (FHFs) bind to the intracellular C-terminal region of the Nav alpha subunit to modulate fast inactivation of the channel. In this study we solved the crystal structure of a 149-residue-long fragment of human FHF2A which unveils the structural features of the homology core domain of all 10 human FHF isoforms. Through analysis of crystal packing contacts and site-directed mutagenesis experiments we identified a conserved surface on the FHF core domain that mediates channel binding in vitro and in vivo. Mutations at this channel binding surface impaired the ability of FHFs to co-localize with Navs at the axon initial segment of hippocampal neurons. The mutations also disabled FHF modulation of voltage-dependent fast inactivation of sodium channels in neuronal cells. Based on our data, we propose that FHFs constitute auxiliary subunits for Navs.


Figures

FIGURE 1.
FIGURE 1.
Schematic of FHF and channel constructs used in this study. A, FHF constructs. Boundaries of each construct are labeled. The boundaries of the FHF homology core region are shaded gray. B, topology of the Nav α subunit. The four homologous domains of the α subunit (labeled I-IV), each containing six transmembrane α-helical segments (gray rods labeled 1–6) form the ion conduction pore. The fourth segment of each domain contains positive charge clusters (++) and is part of the voltage sensors. The intracellular loop linking domains III and IV functions as the fast inactivation gate (highlighted in bold). The C-terminal region, which binds FHFs, is boxed, and the primary sequence of this region in murine Nav1.6 (residues 1765–1911) is shown. The positions of pathogenic mutations in this channel region are shaded gray.
FIGURE 2.
FIGURE 2.
FHFs form 1:1 complexes with the C-terminal domain of Nav1.5 regardless of N-terminal alternative splicing. Shown is a representative SPR sensorgram of FHF1A1–243 binding to Nav1.5CT (A) and a representative SPR sensorgram of FHF1B1–181 binding to Nav1.5CT (B) and fitted saturation binding curves. FHF1 proteins were immobilized on a biosensor chip, and increasing concentrations of Nav1.5CT were passed over the chip. Dissociation constants (KD) were calculated from the saturation binding curves. C, representative stack plot of size-exclusion chromatograms of FHF3A55–225 alone, Nav1.5CT alone, and FHF3A55–225 mixed with Nav1.5CT at molar ratios of 1:0.5, 1:1, and 1:2. Vertical lines indicate the retention times of FHF3A55–225 and Nav1.5CT. Arrows indicate the retention times of molecular size standards, the void volume (Vv), and the column volume (Vc).
FIGURE 3.
FIGURE 3.
FHFs bind to the C-terminal domain of multiple Nav α subunits. Representative SPR sensorgrams illustrating binding of FHF2A53–245, FHF3A55–225, and FHF4B64–252 to Nav1.1CT, Nav1.2CT, and Nav1.5CT and binding of FHF2A53–245 and FHF3A55–225 to Nav1.9CT. Channel C-terminal fragments were immobilized on biosensor chips, and increasing concentrations of FHF protein were passed over the chips. For FHF4B-channel interactions, equilibrium dissociation constants (KD) could be calculated.
FIGURE 4.
FIGURE 4.
Structure-based sequence alignment of all 10 human FHF isoforms. For comparison, the sequence of FGF2 is included in the alignment. Secondary structure elements (β1-β12, g11) are indicated above and below alignments, and residues containing these elements for known secondary structures are boxed. β1 and β12 strands of FHF1 (PDB ID 1Q1U; Ref. 8) are indicated by dashed boxes. Note that these strands are shorter than the corresponding β strands of FHF2 due to C-terminal truncation of the crystallized FHF1B protein (see also Fig. 6B). A slash in each sequence marks the junction between alternatively spliced N-terminal region and FHF homology core region. Sequence alignment was optimized by introducing gaps (dashes). The FHF homology core region is shaded light gray, and the 18-residue-long C-terminal extension not shared with FGFs is indicated by a box drawn around the sequences. Residues of the FHF homology region engaged in channel binding are shaded darker gray. Channel binding residues are conserved among all FHFs, and all but three of these residues are divergent from corresponding FGF residues.
FIGURE 5.
FIGURE 5.
The 18-residue-long FHF-invariant C-terminal extension of the FHF homology region is essential for FHF binding to the C-terminal domain of Nav1.5. A, overlaid size-exclusion chromatograms of FHF1B1–156 alone, Nav1.5CT alone, and a 1:1 mixture of Nav1.5CT with FHF1B1–156. B, overlaid size-exclusion chromatograms of FHF1B1–142 alone, Nav1.5CT alone, and a 1:1 mixture of Nav1.5CT with FHF1B1–142. Arrows indicate the retention times of molecular size standards and the column volume (Vc).
FIGURE 6.
FIGURE 6.
Crystal structure of FHF2A. A, ribbon representation of the crystal structure of the FHF homology core region of FHF2A. The FHF2A structure includes the C-terminal epitope required for FHF interaction with Navs. The β strands are labeled according to the conventional strand nomenclature for FGF1 and FGF2. NT and CT denote the N and C termini of the FHF2A core region. B, superimposition of the Cα trace of the FHF2A β-trefoil (orange) onto the Cα trace of the FHF1B β-trefoil (green; PDB ID 1Q1U; Ref. 8) shown in stereo view. The C-terminal residues 200–206 strand pair with N-terminal residues 64–69, and therefore, β1 and β12 are longer than the corresponding β strands in FHF1B (see also Figs. 4 and 5, B and C). C, molecular surface representation of part of the FHF2A β-trefoil core and ribbon representation of the C-terminal epitope (residues 200–212) required for channel binding. The C-terminal epitope is tethered to the β-trefoil core and masks a hydrophobic patch in the FHF core whose homologous region in FGFs binds to the Ig domain III of FGFRs. Tyr-204, Pro-207, Leu-209, and Leu-212 of the C-terminal epitope (residues colored cyan blue) engage in hydrophobic interactions with residues of the β-trefoil core, which are colored red and labeled.
FIGURE 7.
FIGURE 7.
The crystal structure of FHF2A unveils a conserved surface region implicated in channel binding. A, molecular surface and ribbon representation of the FHF2A dimer within the crystal asymmetric unit. FHF2A monomers are colored orange and cyan blue, respectively. NT and CT denote the N and C termini of the FHF2A core region. B, stereo view of the boxed region (panel A) showing some of the interactions taking place at the interface between the two FHF2A molecules of the dimer in the asymmetric unit. The hydrophobic patch formed by Tyr-151, Tyr-152, and Leu-195 of one molecule and Ile-69, Pro-198, and Val-201 of the other molecule is illustrated. Hydrogen bonding at the periphery of this patch between Lys-67 of one molecule and Glu-149 of the other is also shown (marked by a dashed black line). Water molecules are shown as red spheres. The blue mesh corresponds to the 2FoFc electron density map contoured at σ = 1.0. C, molecular surface representation of one of the two FHF2A molecules of the asymmetric unit. The molecule has been rotated by about 40° relative to the orientation of one of the monomers shown in panel A. Channel binding residues buried in the FHF2A dimer interface are colored deep blue (compare this figure with panel B), and channel binding residues in the vicinity of the dimer interface are colored slate blue. Except for Asn-150, Tyr-152, and Leu-195, these residues have diverged from FGFs (see also Fig. 4). Residues mutated for in vitro/in vivo validation of the channel binding site are marked by a black box.
FIGURE 8.
FIGURE 8.
Structure-based mutagenesis identifies FHF residues that mediate FHF binding to the C-terminal domain of Navs. A, representative SPR sensorgrams illustrating interaction of wild-type and mutant FHF2A proteins with the C-terminal (CT) fragments of Nav1.5, Nav1.6, and Nav1.9. Channel C-terminal fragments were immobilized on a biosensor chip, and increasing concentrations of either wild-type or mutant FHF2A protein were passed over the chip. Maximal binding responses of FHF2A mutants relative to wild-type protein were plotted. Note the reduction in mutant FHF binding to channels (2–5-fold) compared with wild-type FHF-channel interaction. B, representative stack plot of size-exclusion chromatograms of FHF2A53–245 alone, Nav1.5CT alone, and 1:1 mixtures of Nav1.5CT with either wild-type or mutant FHF2A53–245. Vertical lines indicate the retention times of FHF2A53–245, Nav1.5CT, and FHF2A53–245-Nav1.5CT complex. Arrows indicate the retention times of molecular size standards, the void volume (Vv), and the column volume (Vc).
FIGURE 9.
FIGURE 9.
Effects of mutations in the Nav-binding site of FHF2 on subcellular targeting in hippocampal neurons and modulation of channel fast inactivation in Neuro2A cells. Shown are representative images of rat hippocampal neurons transfected with FHF2A-GFP (panels A–D) or FHF2Aocta-mutant-GFP (panels E–H) and processed for GFP immunofluorescence (panels A and E) and ankyrin G immunofluorescence (panels B and F). Co-fluorescence images pseudo-colored green (GFP) and blue (ankyrin G) are shown in panels C and G. Axons (arrows) and dendrites (arrowheads) are indicated. Boxed regions containing axon hillock and initial segment (AIS) are shown enlarged (images a–c, e–g). Panels d and h show immunofluorescence intensity line scans for GFP (green) and ankyrin G (blue) along a 5-micron distance spanning the transition from the axon hillock to the AIS. Relative immunofluorescence was plotted (fluorescence at the junction between hillock and AIS set to unity). I, AIS enrichment index (AIS:dendrite fluorescence intensity ratio) was calculated for neurons expressing either FHF2A-GFP (n = 8) or FHF2Aocta-mutant-GFP (n = 5). ***, p < 0.001 compared with FHF2Aocta-mutant-GFP. J, voltage dependence of channel fast inactivation was recorded in Neuro2A cells expressing wild-type FHF2A (filled squares, n = 16), FHF2Aocta-mutant (open squares, n = 12), wild-type FHF2B (filled triangles, n = 8), FHF2Bocta-mutant (open triangles, n = 10), or no FHF (open circles, n = 15). For each of the five groups, the mean channel availability following a preconditioning 60-ms pulse at each voltage is shown. K, anti-FHF2 immunoblot demonstrates equally robust expression of wild-type and mutant FHF2A and FHF2B proteins in transfected Neuro2A cells.
FIGURE 10.
FIGURE 10.
Impact of mutations in the Nav-binding site of FHF4B on subcellular targeting in hippocampal neurons. Panels A, E, and I show FHF4 staining visualized as GFP fluorescence, and panels B, F, J, and N show βIV-spectrin labeling visualized as Alexa350 fluorescence. FHF4/βIV-spectrin double labeling (GFP/Alexa350 co-fluorescence) is shown in panels C, G, and K. Panels a–o are magnifications of the boxed AIS regions in each of the panels A–O. AU, absorbance units. White arrows mark the AIS. White scale bars (images O and o) correspond to 10 μm. Panels D, H, L, and P show fluorescence intensity line scans for GFP (green) and βIV-spectrin (blue) over distance from the cell soma of the neurons shown to the left. Q, AIS enrichment index (AIS:dendrite fluorescence intensity ratio) was calculated for neurons expressing FHF4B-GFP (n = 4), FHF4BR117G-GFP (n = 3), FHF4BY158N/V160N-GFP (n = 6), and GFP alone (n = 5). ***, p < 0.001 compared with GFP.

Similar articles

Cited by

References

    1. Catterall W. A. ( 2000) Neuron 26, 13– 25 - PubMed
    1. Catterall W. A., Goldin A. L., Waxman S. G. ( 2005) Pharmacol. Rev. 57, 397– 409 - PubMed
    1. Patton D. E., West J. W., Catterall W. A., Goldin A. L. ( 1993) Neuron 11, 967– 974 - PubMed
    1. West J. W., Patton D. E., Scheuer T., Wang Y., Goldin A. L., Catterall W. A. ( 1992) Proc. Natl. Acad. Sci. U.S.A. 89, 10910– 10914 - PMC - PubMed
    1. Motoike H. K., Liu H., Glaaser I. W., Yang A. S., Tateyama M., Kass R. S. ( 2004) J. Gen. Physiol. 123, 155– 165 - PMC - PubMed

Publication types

MeSH terms

Associated data

LinkOut - more resources