

Identification of human S100A9 as a novel target for treatment of autoimmune disease via binding to quinoline-3-carboxamides
- PMID: 19402754
- PMCID: PMC2671563
- DOI: 10.1371/journal.pbio.1000097
Identification of human S100A9 as a novel target for treatment of autoimmune disease via binding to quinoline-3-carboxamides
Abstract
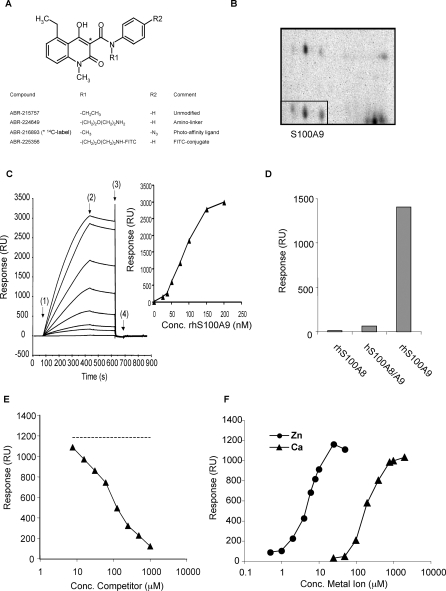
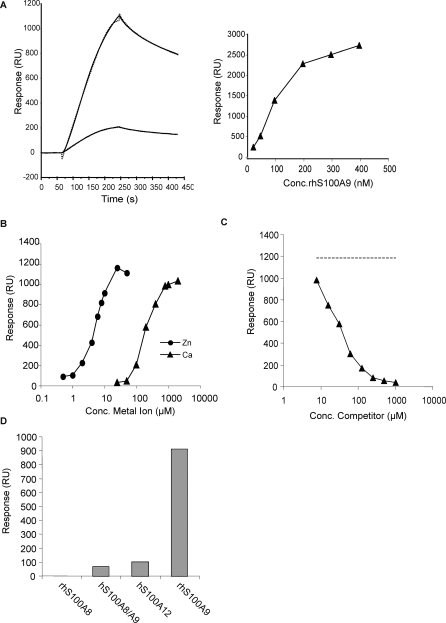
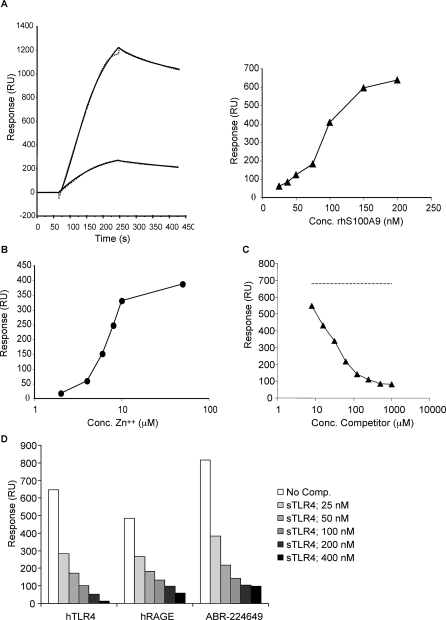
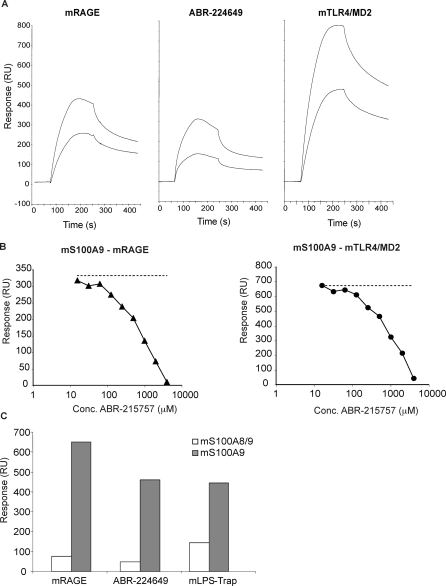
Despite more than 25 years of research, the molecular targets of quinoline-3-carboxamides have been elusive although these compounds are currently in Phase II and III development for treatment of autoimmune/inflammatory diseases in humans. Using photoaffinity cross-linking of a radioactively labelled quinoline-3-carboxamide compound, we could determine a direct association between human S100A9 and quinoline-3-carboxamides. This interaction was strictly dependent on both Zn++ and Ca++. We also show that S100A9 in the presence of Zn++ and Ca++ is an efficient ligand of receptor for advanced glycation end products (RAGE) and also an endogenous Toll ligand in that it shows a highly specific interaction with TLR4/MD2. Both these interactions are inhibited by quinoline-3-carboxamides. A clear structure-activity relationship (SAR) emerged with regard to the binding of quinoline-3-carboxamides to S100A9, as well as these compounds potency to inhibit interactions with RAGE or TLR4/MD2. The same SAR was observed when the compound's ability to inhibit acute experimental autoimmune encephalomyelitis in mice in vivo was analysed. Quinoline-3-carboxamides would also inhibit TNFalpha release in a S100A9-dependent model in vivo, as would antibodies raised against the quinoline-3-carboxamide-binding domain of S100A9. Thus, S100A9 appears to be a focal molecule in the control of autoimmune disease via its interactions with proinflammatory mediators. The specific binding of quinoline-3-carboxamides to S100A9 explains the immunomodulatory activity of this class of compounds and defines S100A9 as a novel target for treatment of human autoimmune diseases.
Conflict of interest statement
Competing interests. PB, AB, MS, DL, AO, and TL are employees of Active Biotech, which is developing quinolines for commercial purposes. FI has a research grant from Active Biotech.
Figures


Similar articles
-
S100A9 induced inflammatory responses are mediated by distinct damage associated molecular patterns (DAMP) receptors in vitro and in vivo.PLoS One. 2015 Feb 23;10(2):e0115828. doi: 10.1371/journal.pone.0115828. eCollection 2015. PLoS One. 2015. PMID: 25706559 Free PMC article.
-
Common interactions between S100A4 and S100A9 defined by a novel chemical probe.PLoS One. 2013 May 8;8(5):e63012. doi: 10.1371/journal.pone.0063012. Print 2013. PLoS One. 2013. PMID: 23667563 Free PMC article.
-
S100A8 and S100A9 mediate endotoxin-induced cardiomyocyte dysfunction via the receptor for advanced glycation end products.Circ Res. 2008 May 23;102(10):1239-46. doi: 10.1161/CIRCRESAHA.107.167544. Epub 2008 Apr 10. Circ Res. 2008. PMID: 18403730
-
S100A12 and the S100/Calgranulins: Emerging Biomarkers for Atherosclerosis and Possibly Therapeutic Targets.Arterioscler Thromb Vasc Biol. 2015 Dec;35(12):2496-507. doi: 10.1161/ATVBAHA.115.302072. Epub 2015 Oct 29. Arterioscler Thromb Vasc Biol. 2015. PMID: 26515415 Free PMC article. Review.
-
Inflammation-associated S100 proteins: new mechanisms that regulate function.Amino Acids. 2011 Oct;41(4):821-42. doi: 10.1007/s00726-010-0528-0. Epub 2010 Mar 6. Amino Acids. 2011. PMID: 20213444 Review.
Cited by
-
Deficiency of myeloid-related proteins 8 and 14 (Mrp8/Mrp14) does not block inflammaging but prevents steatosis.Oncotarget. 2016 Jun 14;7(24):35535-35551. doi: 10.18632/oncotarget.9550. Oncotarget. 2016. PMID: 27224926 Free PMC article.
-
The Good and the Bad: Monocytes' and Macrophages' Diverse Functions in Inflammation.Cells. 2022 Jun 20;11(12):1979. doi: 10.3390/cells11121979. Cells. 2022. PMID: 35741108 Free PMC article. Review.
-
Identification of gp96 as a novel target for treatment of autoimmune disease in mice.PLoS One. 2010 Mar 23;5(3):e9792. doi: 10.1371/journal.pone.0009792. PLoS One. 2010. PMID: 20352117 Free PMC article.
-
Platelet Versus Megakaryocyte: Who Is the Real Bandleader of Thromboinflammation in Sepsis?Cells. 2022 Apr 30;11(9):1507. doi: 10.3390/cells11091507. Cells. 2022. PMID: 35563812 Free PMC article. Review.
-
DSS-induced inflammation in the colon drives a proinflammatory signature in the brain that is ameliorated by prophylactic treatment with the S100A9 inhibitor paquinimod.J Neuroinflammation. 2021 Nov 10;18(1):263. doi: 10.1186/s12974-021-02317-6. J Neuroinflammation. 2021. PMID: 34758843 Free PMC article.
References
-
- Andersen O, Lycke J, Tollesson PO, Svenningsson A, Runmarker B, et al. Linomide reduces the rate of active lesions in relapsing-remitting multiple sclerosis. Neurology. 1996;47:895–900. - PubMed
-
- Karussis DM, Meiner Z, Lehmann D, Gomori JM, Schwarz A, et al. Treatment of secondary progressive multiple sclerosis with the immunomodulator linomide: a double-blind, placebo-controlled pilot study with monthly magnetic resonance imaging evaluation. Neurology. 1996;47:341–346. - PubMed
-
- Noseworthy JH, Wolinsky JS, Lublin FD, Whitaker JN, Linde A, et al. Linomide in relapsing and secondary progressive MS: part I: trial design and clinical results. North American Linomide Investigators. Neurology. 2000;54:1726–1733. - PubMed
-
- Polman C, Barkhof F, Sandberg-Wollheim M, Linde A, Nordle O, et al. Treatment with laquinimod reduces development of active MRI lesions in relapsing MS. Neurology. 2005;64:987–991. - PubMed
-
- Coutant R, Landais P, Rosilio M, Johnsen C, Lahlou N, et al. Low dose linomide in Type I juvenile diabetes of recent onset: a randomised placebo-controlled double blind trial. Diabetologia. 1998;41:1040–1046. - PubMed
Publication types
MeSH terms
Substances
LinkOut - more resources
Full Text Sources
Other Literature Sources
Medical
Molecular Biology Databases
Miscellaneous
