. 2009;4(4):e5250.
doi: 10.1371/journal.pone.0005250. Epub 2009 Apr 21.

NMDA receptor stimulation induces reversible fission of the neuronal endoplasmic reticulum

Affiliations

NMDA receptor stimulation induces reversible fission of the neuronal endoplasmic reticulum

Krzysztof Kucharz et al. PLoS One. 2009.

Abstract

With few exceptions the endoplasmic reticulum (ER) is considered a continuous system of endomembranes within which proteins and ions can move. We have studied dynamic structural changes of the ER in hippocampal neurons in primary culture and organotypic slices. Fluorescence recovery after photobleaching (FRAP) was used to quantify and model ER structural dynamics. Ultrastructure was assessed by electron microscopy. In live cell imaging experiments we found that, under basal conditions, the ER of neuronal soma and dendrites was continuous. The smooth and uninterrupted appearance of the ER changed dramatically after glutamate stimulation. The ER fragmented into isolated vesicles in a rapid fission reaction that occurred prior to overt signs of neuronal damage. ER fission was found to be independent of ER calcium levels. Apart from glutamate, the calcium ionophore ionomycin was able to induce ER fission. The N-methyl, D-aspartate (NMDA) receptor antagonist MK-801 inhibited ER fission induced by glutamate as well as by ionomycin. Fission was not blocked by either ifenprodil or kinase inhibitors. Interestingly, sub-lethal NMDA receptor stimulation caused rapid ER fission followed by fusion. Hence, ER fission is not strictly associated with cellular damage or death. Our results thus demonstrate that neuronal ER structure is dynamically regulated with important consequences for protein mobility and ER luminal calcium tunneling.


Conflict of interest statement

Competing Interests: The authors have declared that no competing interests exist.

Figures

Figure 1
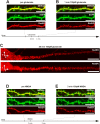
Figure 1. ER fission induced by glutamate or NMDA.
(A) Representative image of a dendrite of a living hippocampal neuron transfected to express cytosolic EGFP and RedER showing normal ER morphology. (B) When exposed to 100 µM glutamate, rapid fission of the ER occurred after 1 min. Note the lack of change in dendritic and dendritic spine morphology in the green channel. (C) Image of proximal dendrite exposed to 100 µM glutamate for 20 min clearly showing the fragmented appearance of the ER in the xy (upper panel) and xz (lower panel) dimensions. (D) Representative image of a dendrite with normal morphology. (E) When exposed to 100 µM NMDA, rapid fission of the ER occurred within 3 min. Note the lack of change in dendritic and dendritic spine morphology in the green channel. Scale bar in all panels: 10 µm.
Figure 2
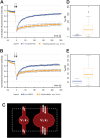
Figure 2. Analysis of ER fission by FRAP.
(A and B) Normalized average FRAP signal over time in untreated neurons (blue) and the same neurons after (A) 100 µM glutamate, or (B) 100 µM NMDA (orange). Photobleaching was performed between the arrows. Time = 0 was set to when photobleaching ends and fluorescence starts to recover. Error bars are standard error of the mean (SEM). n = 19 for glutamate; n = 17 for NMDA. (C) The ER within the ROI (dashed line) was modeled as consisting of two volumes: V1 and V2. The RedER molecules move within these volumes with rate constants k1 and k2 respectively. (D and E) Box plot of τeff values of the same neurons shown in A and B. Untreated neurons are blue and the same neurons after (D) 100 µM glutamate or (E) NMDA are orange. Note the difference in scale between D and E. The line in the box is the median and the box represents the 25–75 percentiles. Whiskers extend to the extreme values as long as they are within a range of 1.5× box length. Values outside this range are plotted as outliers. avg.: average.
Figure 3
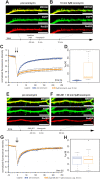
Figure 3. Reversibility of ER fission.
(A) Representative image of a dendrite from a neuron with normal dendritic and ER structure. (B) 100 µM of NMDA caused rapid ER fission without any effect on gross dendritic structure. (C) Antagonizing NMDA receptor activation by 25 µM MK-801 allowed for ER fusion and recovery of ER structure by 24 h. (D) Normalized average FRAP signal over time in untreated neurons (blue), the same neurons after NMDA for an average of 20 min (orange) (note that MK-801 was added after 2–5 min) and after MK-801 for 24 h (purple). Photobleaching was performed between the arrows. Time = 0 was set to when photobleaching ends and fluorescence starts to recover. Error bars are SEM. n = 20. (E) Box plot of τeff values in untreated neurons (blue) and the same neurons after NMDA (orange) and MK-801 (purple). The line in the box is the median and the box represents the 25–75 percentiles. Whiskers extend to the extreme values as long as they are within a range of 1.5× box length. Scale bar in all panels: 10 µm. avg.: average.
Figure 4
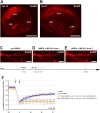
Figure 4. Reversible ER fission in organotypic slices.
(A) Hippocampal expression of RedER in Thy1-RedER transgenic mouse line 18. (B) RedER expression in line 27. The expression pattern of the transgene differs slightly in that line 18 has no expression in pyramidal cells of CA3 but does express at high level in the hilus. (C) Representative images of dendritic ER structure in a CA3 pyramidal cell from line 27 with continuous ER prior to any treatment. (D) 100 µM NMDA triggered rapid ER fission. (E) 25 µM MK-801 led to fusion within 25 min. (F) Normalized average FRAP signal over time in untreated neurons (blue), the same neurons after NMDA for 10 min (orange) (note that MK-801 was added after 5 min) and after MK-801 (purple). Photobleaching was performed between the arrows. Time = 0 was set to when photobleaching ends and fluorescence starts to recover. Error bars are SEM. n = 4 neurons in 4 slices. Scale bars: 500 µm in A and B, 10 µm in C-E. avg.: average.
Figure 5
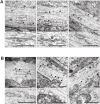
Figure 5. EM analysis of SER in dendrites.
(A) Three representative images of dendrites from CA1 and CA3 in organotypic slices. ER profiles are indicated by arrows. (B) The ultrastructure after 100 µM glutamate for 5 min before fixing. No normal SER profiles were seen; instead the dendritic cytosol contains numerous dilated vesicles indicated by arrows. Boxed areas in the low magnification panel are enlarged below. Scale bar in all panels 500 nm.
Figure 6
Figure 6. EM analysis of RER in neuronal somata.
(A) Three representative images of CA1 and CA3 somata with normal ultrastructure. RER membranes studded with ribosomes are indicated with arrows. (B) The ultrastructure after 100 µM glutamate for 5 min. No normal RER profiles can be seen; instead the cytosol contains numerous dilated vesicles or tubules/cisterns that appear to have fewer ribosomes attached. Scale bar in all panels 500 nm.
Figure 7
Figure 7. Inhibition of NMDA receptors is sufficient to block glutamate-induced ER fission.
(A) Representative image of a dendrite from a neuron with normal dendritic and ER structure. (B) Treatment with 25 µM MK-801 for 10 min prior to 100 µM glutamate prevented ER fission although an effect on gross dendritic structure was seen (reduction in spine length). (C) After 24 h, 19 out of 20 cells had survived and resumed normal morphology. (D) Normalized average FRAP signal over time in untreated neurons (blue), the same neurons after MK-801 and glutamate for an average of 35 min (orange) and after 24 h (purple). Photobleaching was performed between the arrows. Time = 0 was set to when photobleaching ends and fluorescence starts to recover. Error bars are SEM. (E) Box plot of τeff values in untreated neurons (blue) and the same neurons after glutamate (orange). The line in the box is the median and the box represents the 25–75 percentiles. Whiskers extend to the extreme values as long as they are within a range of 1.5× box length. One neuron was outside this range and plotted as an outlier. Scale bars in all panels: 10 µm. avg.: average.
Figure 8
Figure 8. Ionomycin triggers NMDA receptor-mediated ER fission.
(A) Representative image of a dendrite from a neuron with normal dendritic and ER structure. (B) Treatment with 5 µM ionomycin for 10 min caused ER fission along with a pronounced effect on gross dendritic structure (dendritic blebbing). (C) Normalized average FRAP signal over time in untreated neurons (blue) and the same neurons after ionomycin for an average of 35 min (orange). Photobleaching was performed between the arrows. Time = 0 was set to when photobleaching ends and fluorescence starts to recover. Error bars are SEM. n = 18. (D) Box plot of τeff values in untreated neurons (blue) and the same neurons after ionomycin (orange). The line in the box is the median and the box represents the 25–75 percentiles. Whiskers extend to the extreme values as long as they are within a range of 1.5× box length. (E) Representative image of a dendrite from a neuron with normal dendritic and ER structure. (F) Treatment with 25 µM MK-801 for 20 min prior to 5 µM ionomycin prevented ER fission and only caused minor effects on gross dendritic structure. (G) Normalized average FRAP signal over time in untreated neurons (blue) and the same neurons after MK-801 and ionomycin for an average of 50 min (orange). Photobleaching was performed between the arrows. Time = 0 was set to when photobleaching ends and fluorescence starts to recover. Error bars are SEM. n = 18. (H) Box plot of τeff values in untreated neurons (blue) and the same neurons after ionomycin (orange). The line in the box is the median and the box represents the 25–75 percentiles. Whiskers extend to the extreme values as long as they are within a range of 1.5× box length. One neuron was outside this range and plotted as an outlier. Scale bar in all panels: 10 µm. avg.: average.
Figure 9
Figure 9. NMDA receptor activation may cause a shift in the balance between fission and fusion events.
Rather than viewing the ER as having two static structural states (continuous and fragmented) the ER membranes may be undergoing constant fission and fusion events. In the resting state fusion events balance fission events. After NMDA receptor stimulation this balance may be shifted so that fusion events are more rare than fission events.

Similar articles

Cited by

References

    1. Bardo S, Cavazzini MG, Emptage N. The role of the endoplasmic reticulum Ca2+ store in the plasticity of central neurons. Trends Pharmacol Sci. 2006;27:78–84. - PubMed
    1. DeGracia DJ, Montie HL. Cerebral ischemia and the unfolded protein response. J Neurochem. 2004;91:1–8. - PubMed
    1. Lindholm D, Wootz H, Korhonen L. ER stress and neurodegenerative diseases. Cell Death Differ. 2006;13:385–392. - PubMed
    1. Mattson MP. Calcium and neurodegeneration. Aging Cell. 2007;6:337–350. - PubMed
    1. Meldolesi J. Rapidly exchanging Ca2+ stores in neurons: molecular, structural and functional properties. Prog Neurobiol. 2001;65:309–338. - PubMed

Publication types

Substances