. 2009 May-Jun;2(5-6):247-66.
doi: 10.1242/dmm.000653. Epub 2009 Apr 6.

Inactivation of Drosophila Huntingtin affects long-term adult functioning and the pathogenesis of a Huntington's disease model

Affiliations

Inactivation of Drosophila Huntingtin affects long-term adult functioning and the pathogenesis of a Huntington's disease model

Sheng Zhang et al. Dis Model Mech. 2009 May-Jun.

Abstract

A polyglutamine expansion in the huntingtin (HTT) gene causes neurodegeneration in Huntington's disease (HD), but the in vivo function of the native protein (Htt) is largely unknown. Numerous biochemical and in vitro studies have suggested a role for Htt in neuronal development, synaptic function and axonal trafficking. To test these models, we generated a null mutant in the putative Drosophila HTT homolog (htt, hereafter referred to asdhtt) and, surprisingly, found that dhtt mutant animals are viable with no obvious developmental defects. Instead, dhtt is required for maintaining the mobility and long-term survival of adult animals, and for modulating axonal terminal complexity in the adult brain. Furthermore, removing endogenous dhtt significantly accelerates the neurodegenerative phenotype associated with a Drosophila model of polyglutamine Htt toxicity (HD-Q93), providing in vivo evidence that disrupting the normal function of Htt might contribute to HD pathogenesis.


Figures

Fig. 1
Fig. 1
Ubiquitous expression of dhtt in Drosophila. (A–F) dhtt is widely expressed at a low level during Drosophila development, as revealed by whole-mount in situ hybridization. (A,B) Stage 15 Drosophila embryos stained with digoxigenin (DIG)-labeled dhtt antisense probes revealed the low-level and ubiquitous expression of the dhtt transcript (A); control embryos at the corresponding stage, which were stained with dhtt sense probes, showed only minimal background signals (B). All embryos are lateral views, anterior to the left and dorsal side up. (C–F) Third instar larval tissues hybridized with dhtt antisense probes. Low-level and ubiquitous dhtt expression was observed in the brain (C), wing and leg (D) and eye imaginal discs (E). (F) A negative in situ control – an eye imaginal disc from a dhtt deletion mutant stained in parallel – showed only minimal background signals. (G–K) The dHtt protein predominantly localizes to the cytoplasm. (G,H) In transfected Drosophila S2 cells, ectopically expressed dHtt protein (green) was found predominantly in the cytoplasm; it was also found on cellular protrusions, but was mostly excluded from the nucleus. (G) Overlaying images of the S2 cells co-stained with phalloidin (red), which detects F–actin, and the DNA dye DAPI (blue) reveal the overall cell morphology and the cell nuclei, respectively. (I–K) Cytoplasmic localization of the dHtt protein (green) ectopically expressed in Drosophila third instar larval imaginal disc tissues. (I) The anti-dHtt antibody can recognize overexpressed dHtt in the patched expression domain driven by patched-Gal4 and shows the characteristic striped dHtt expression pattern in the middle of the wing and leg imaginal discs. Genotype: patched-Gal4/+>UAS-dhtt/+. (J,K) High-magnification view of an eye imaginal disc with ectopically expressed dHtt protein [green (J)], which shows a mainly cytoplasmic localization. (K) Overlaying images of the same eye disc region co-stained with DAPI (red) to reveal the cell nuclei. Genotype: GMR-Gal4/+>UAS-dhtt/+.
Fig. 2
Fig. 2
Genomic organization of the dhtt locus and the dhtt-ko deletion. (A) The genomic structure of cytological region 98E2. The scale bar on top indicates the gene size (in base pairs). The position and transcriptional direction of dhtt and nearby genes (open boxes) is shown; introns (dashed lines) and exons (colored filled boxes) are labeled, as well as the FRT insertions (triangles) used for generating the Df(98E2) deficiency. (B) dhtt-ko was generated by an FRT-mediated precise deletion [Df(98E2)] of a 55 kb genomic region covering most of CG9990 and dhtt. A genomic transgene covering the entirety of CG9990 (open box) was reintroduced as a transgenic construct in the Df(98E2) background. (C) Detailed genomic structure of the dhtt gene. The scale bar, with predicted BamHI fragments, is drawn at the top. The exons of the dhtt gene are depicted as red arrows and squares, whereas introns are highlighted as red dashed lines, both are drawn to scale. (D) The dhtt-ko removes all but the last two of the 29 exons in dhtt, as verified by Southern blotting using BamHI digestion of genomic DNA. DNA extracted from control and dhtt-ko adult animals was hybridized with a DNA probe targeting all exons of dhtt (see Methods). The two BamHI fragments (1.95 kb and 1.59 kb) that contain the last two remaining exons in dhtt-ko mutants are highlighted in (C).
Fig. 3
Fig. 3
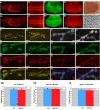
dhtt is dispensable for Drosophila development. (A) Normal development of the CNS during embryogenesis in dhtt-ko flies (A3,A4) compared with wild-type controls (A1,A2), as revealed by anti-Armadillo staining. (A2,A4) Enlarged views of the ventral nerve cord in wild-type (A2) and dhtt-ko (A4) embryos show its regular ladder-like structure. (B) Differentiation and patterning of the eye during the third instar larval stage in dhtt-ko flies (B3,B4) is indistinguishable from wild-type controls (B1,B2), as revealed by anti-Elav staining (red) (B2,B4) to label differentiated neurons and phalloidin staining for F-actin (green) (B1,B3) to reveal the overall cytoskeleton organization. (C,D) Eye images of 40-day-old dhtt-ko mutants. Both the overall external eye morphology (C) and the internal organization of neuronal photoreceptors (D) are normal, even in the 40-day-old dhtt-ko adults. (E–I) Synaptic development is normal in dhtt mutants. Low (E1,E5) and high (E2–E4,E6–E8,F1–F8) magnification confocal images of glutamatergic NMJs in the abdominal segment A3 of third instar muscles 6 and 7. (E) NMJs are double-labeled with the neuronal membrane marker anti-HRP (red) and anti-Dlg (green), which reveal the well-defined presynaptic and postsynaptic NMJ structures in wild-type (E1–E4) and dhtt-ko mutants (E5–E8). (E2–E4,E6–E8) Magnified views of the areas highlighted in (E1,E5). (F) NMJs are labeled with anti-HRP (white) (F1,F5), the periactive zone marker anti-FasII (green) (F2,F6) and the active zone marker nc82 (red) (F3,F7), revealing the normal periactive zone and active zone organization in wild-type (F1–F4) and dhtt-ko flies (F5–F8). (F4,F8) Overlayed images of (F1–F3,F5–F7), respectively. WT: w1118 wild-type control. Bar, 5 μm (in all panels). (G–I) Quantitative analysis of NMJs in muscle 6 and 7 of the abdominal segment A3 for wild-type control (WT, blue) and dhtt-ko mutant (red) flies. (G) Average number of type 1b boutons: WT control=34.5±1.6 (n=24), dhtt-ko mutants=33.5±2.4 (n=21); the difference is statistically insignificant, P=0.72 (Student’s t-test). (H) Average number of total boutons: WT control=63.1±1.8 (n=24), dhtt-ko mutants=62.3±2.0 (n=21); P=0.76. (I) Total number of branches: WT control=18.0±0.6 (n=28), dhtt-ko mutants=17.4±0.6 (n=34); P=0.52. The data in (G–I) are presented as the means±s.e.m. (standard error of the mean).
Fig. 4
Fig. 4
Normal axonal transport in dhtt-ko mutants. Confocal images of wild-type control (A–C) and dhtt-ko (D–F) NMJs and neighboring axons (white arrows) of the larval peripheral nervous system (anti-HRP, red). Synaptic vesicles (green, anti-Syt) are properly delivered to NMJs and show no obvious accumulation in the axons of dhtt-komutants (D–F), similar to the wild-type controls (A–C). Signals for Syt were overexposed in (B,C,E,F) in order to reveal any possible abnormal accumulations of synaptic vesicles within axons (white arrows). (C,F) Overlayed images of double staining with anti-HRP and anti-Syt. WT: w1118 wild-type control. Bars, 10 μm.
Fig. 5
Fig. 5
Compromised mobility and viability of aging dhtt-ko mutants. (A) Spontaneous locomotion assay. dhtt-ko mutants show normal mobility at day 15 but older animals show significantly reduced mobility. (B) Age-dependent survival rate of adult animals. dhtt-ko mutants have a reduced life span. Both the mobility and viability defects in dhtt-ko mutants were rescued by the presence of a dhtt genomic minigene construct (‘dhtt-ko Rescue’). Flies were collected from at least three different batches. The total number of flies counted for viability quantification were: wild type, n=659; dhtt-ko, n =1573; dhtt-ko Rescue, n=804; elav-Gal4/+; dhtt-ko, n=550. The difference between wild-type and dhtt-ko flies is statistically significant, P=0.0001, Student’s t-test. The difference between wild-type and dhtt-ko Rescue flies is not statistically significant, P=0.36. The difference between wild-type and elav-Gal4/+; dhtt-ko flies is statistically significant, P<0.00001. The data in (A,B) are presented as the means±s.e.m. (C) RT-PCR analysis confirmed that expression of endogenous dhtt was lost in dhtt-ko mutants (lane 3) but was restored by the presence of the dhtt genomic minigene rescue construct (lane 4), similar to that in wild-type controls (lane 2). RT-PCR was performed on total RNA samples extracted from adult animals of each of the indicated genotypes. Primers for RT-PCR were located in adjacent exons in the control rp49 gene (the group of four wells on the left) or in neighboring exons at the N-terminal (targeting exons 5 and 6, dhtt-N), middle (targeting exons 13 and 15, dhtt-M) and C-terminal (targeting exons 23 and 24, dhtt-C) regions of the dhtt gene (see Methods). The lane 1s are controls of PCR products from a wild-type genomic DNA template using these primer pairs, which are longer than the RT-PCR products generated by the same pair of primers owing to the spliced-out introns, thus confirming that RT-PCR products were indeed amplified from transcribed RNA templates. w1118: wild-type control.
Fig. 6
Fig. 6
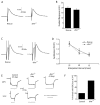
Normal synaptic transmission in dhtt-ko mutants. (A–F) Electrophysiological analyses of dhtt mutants (see Methods). (A) Voltage traces of evoked EJPs recorded from muscle fiber 6 in dhtt mutant or control third instar larvae. (B) Measurements of evoked EJP amplitude. The dhtt-ko mutants exhibited no significant difference in synaptic vesicle release following stimulation (P=0.18, Student’s t-test). Resting membrane potential was unchanged in animals lacking dhtt. (C) Voltage traces and (D) quantification of PPF in control and dhtt mutant third instar larvae. No change in the amplitude of PPF was observed in dhtt mutants, indicating that short-term plasticity is intact. (E) ERGs recorded from controls and dhtt-ko mutants aged 40–45 days or from dhtt-ko mutants aged 1–3 days at 20°C (top graphs) or at 37°C (bottom graphs); heat pulses were given at regular intervals. The black bar below the trace indicates the test light pulses. (F) Percentage of adult animals aged 40–45 days with a loss of phototransduction at 37°C. dhtt-ko mutants showed a more severe temperature-induced loss of phototransduction than control flies, suggesting that photoreceptors in aged dhtt-ko mutants were stress-sensitive compared with the controls. The dhtt-ko Rescue animals were used as controls in the above electrophysiological analyses to ensure a consistent genetic background (A–F). The data in (B) and (D) are presented as the means±s.e.m.
Fig. 7
Fig. 7
Reduced complexity of axonal termini in dhtt-ko brains. (A–C) Brain morphology of a 40-day-old wild-type adult fly as revealed by anti-FasII staining (red) (A), which strongly labels the MBs. In the same brain, A307-positive neurons and their axonal projections are revealed by using a membrane-bound mCD8-eGFP reporter (green) (B). (C) An overlay of images (A) and (B) showing the relative positions of MBs and A307-positive neurons in the brain. A307-positive neurons with prominent axonal projections are highlighted [white arrows in (C)]. The white dashed lines delineate the region magnified in the following pictures (D–O). (D–I) Axonal projection patterns and axon terminal structures of A307-positive neurons in 40-day-old wild-type (D–F) and dhtt-ko mutant (G–I) brains. For clear visualization, the posterior (D,G) and anterior (E,H) of the brains are projected separately. (D,G) A307-positive neurons have a similar axonal projection pattern (white arrows) in dhtt-ko mutant (G) and control brains (D). (E,H) Anterior views of the same brain regions showing the axon terminal structure. The white dashed lines border one axon terminus in each brain, which are further magnified in (F) and (I), respectively. Notice the significant reduction in branching and varicosities at the axonal termini of the dhtt-ko mutant (H,I). (J–O) The MBs (J,M) and axonal termini of A307-labeled neurons (K,N) in another pair of 40-day-old wild-type (J–L) and dhtt-ko mutant (M–O) brains. (M) The overall morphology of the MBs is normal but the signal intensity is weaker in the dhtt-ko mutant. The white dashed lines border one axon terminus in each brain. Note the reduced complexity of axonal termini in the dhtt-ko mutant. The top of each image is the dorsal end of the brain. WT=w1118 wild-type control. Bars, 10 μm (F,I) and 30 μm (all other panels). (P,Q) Quantification of the average area covered by each MB (P) and the relative signal intensity of MBs (Q) between wild-type controls (WT, blue) and dhtt-ko mutants (red), as revealed by anti-FasII staining. When calculating the relative signal intensity of MBs, the value for the average signal intensity from the wild-type controls was set as 100, (s.e.m.=5.8); the relative signal intensity of the dhtt-ko mutants=47.7±6.1; P<0.0001. (R) Quantification of the average total area covered by each A307-positive axonal terminus. The genotypes of each fly line tested are indicated under each chart. WT=w1118 wild-type control. The data in (P–R) are presented as the means±s.e.m.
Fig. 8
Fig. 8
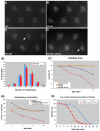
Loss of endogenous dhtt enhances the mobility and viability phenotypes of HD flies. (A–D) Retinal organization, as revealed by pseudopupil imaging of 7-day-old adult eyes. Both wild-type (A) and dhtt-ko flies (B) had well-patterned ommatidium with seven rhabdomeres in each. Adult eyes from HD-Q93 (C) and HD-Q93; dhtt-ko (D) flies both showed an extensive loss of photoreceptors (arrows highlight ommatidia with only three or four rhabdomeres). (E) Histogram showing the number of remaining photoreceptors per ommatidium in 11-day-old adults. A similar profile of degeneration was observed for HD-Q93 flies (red) and HD-Q93; dhtt-ko flies (blue). (F–H) Quantification of climbing ability (F), spontaneous locomotion (G) and age-dependent survival rate (H). The genotypes for each of the fly lines tested are provided within each chart. HD flies with a background dhtt-ko mutation show an accelerated loss of mobility (F,G) and earlier lethality (H). The data in (E–H) are presented as the means±s.e.m.
Fig. 9
Fig. 9
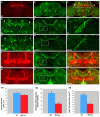
Loss of endogenous dhtt affects the pathogenesis of HD flies. (A–J) Loss of endogenous dhtt causes enhanced brain pathology in HD flies. Confocal images of adult brains showing the distribution of neuronal cells (anti-Elav, green), cell nuclei (DAPI, white) and MBs (anti-FasII, red) in 5-day-old HD-Q93 (D–H) and HD-Q93; dhtt-ko (I–M) brains. As cells in the fly brain are mainly localized at its surface, the anterior (A,B,F,G) and posterior (D,E,I,J) halves of the brains are projected separately for better visualization of the distribution pattern. Note the enlarged regions devoid of neuronal cells in the HD-Q93; dhtt-ko brain (F) (the areas within the white lines) compared with the corresponding regions in the HD-Q93 brain (A). The arrows in (I) indicate the areas lacking neuronal cells at the posterior of the brain. (C,H) The MB in the HD-Q93; dhtt-ko brain (H) is also less well organized and shows weaker signal intensity than in the HD-Q93 brain (C). The white arrowheads highlight the clear separation, along the midline, between the two medial β-lobes in the HD-Q93; dhtt-ko brain (C), this is less distinct and appears merged in the HD-Q93 brain (H). White arrows indicate the bulged tip of the vertical α-lobes, which become less distinct in HD-Q93; dhtt-ko brains (H). WT=w1118 wild-type control. Bars, 50 μm (all panels). (K,L) Quantification of the average MB size (K) and relative signal intensity (L) of MBs in HD-Q93 (blue) and HD-Q93; dhtt-ko mutants (red), as revealed by anti-FasII staining. In both HD-Q93 and HD-Q93; dhtt-ko flies, the FasII signals for the γ-lobe in MBs were too weak to be tracked reliably (see supplementary material Figs S7 and S8); therefore, only the α- and β-lobes in each MB were measured. (M,N) Quantification of the average brain size (M) and the total size of the regions devoid of neuronal cells in the anterior brain (N), as revealed by using neuronal-specific staining with an antibody against Elav. The data in (K–N) are presented as the means±s.e.m.

Comment in

  • Hunting for the function of Huntingtin.
    Zheng Q, Joinnides M. Zheng Q, et al. Dis Model Mech. 2009 May-Jun;2(5-6):199-200. doi: 10.1242/dmm.003376. Dis Model Mech. 2009. PMID: 19407322 Free PMC article. No abstract available.

Similar articles

Cited by

References

    1. Andrade M.A., Bork P. (1995). HEAT repeats in the Huntington’s disease protein. Nat Genet. 11, 115–116 - PubMed
    1. Andrade M.A., Petosa C., O’Donoghue S.I., Muller C.W., Bork P. (2001). Comparison of ARM and HEAT protein repeats. J Mol Biol. 309, 1–18 - PubMed
    1. Atkinson N.S., Robertson G.A., Ganetzky B. (1991). A component of calcium-activated potassium channels encoded by the Drosophila slo locus. Science 253, 551–555 - PubMed
    1. Auerbach W., Hurlbert M.S., Hilditch-Maguire P., Wadghiri Y.Z., Wheeler V.C., Cohen S.I., Joyner A.L., MacDonald M.E., Turnbull D.H. (2001). The HD mutation causes progressive lethal neurological disease in mice expressing reduced levels of huntingtin. Hum Mol Genet. 10, 2515–2523 - PubMed
    1. Budnik V., Gramates L.S. (1999). Neuromuscular Junctions in Drosophila. San Diego, CA: London: Academic Press

Publication types

MeSH terms