

Impulse conduction and gap junctional remodelling by endothelin-1 in cultured neonatal rat ventricular myocytes
- PMID: 19374685
- PMCID: PMC2864006
- DOI: 10.1111/j.1582-4934.2008.00361.x
Impulse conduction and gap junctional remodelling by endothelin-1 in cultured neonatal rat ventricular myocytes
Abstract
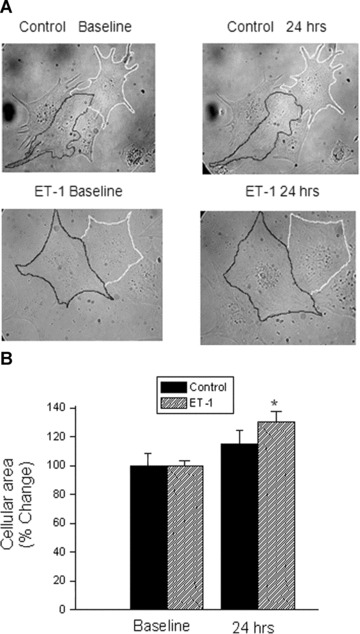
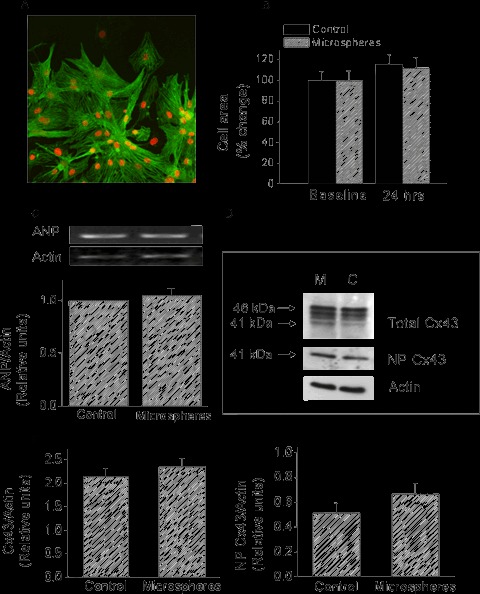
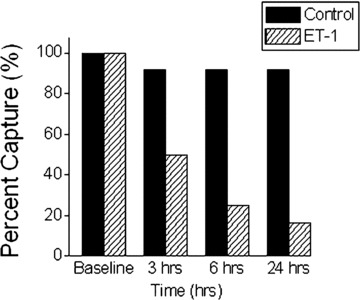
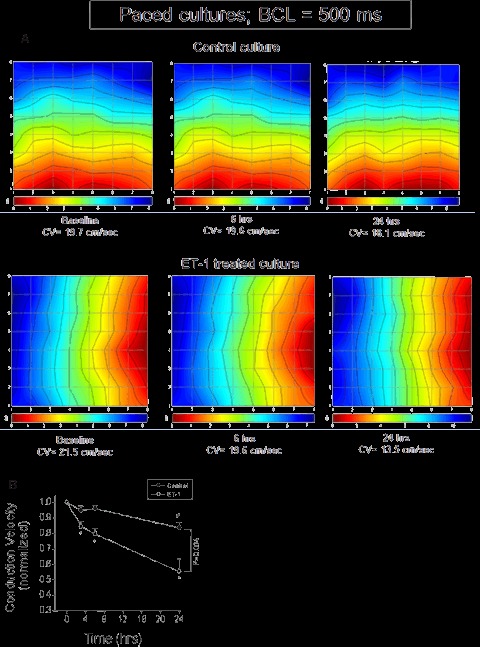
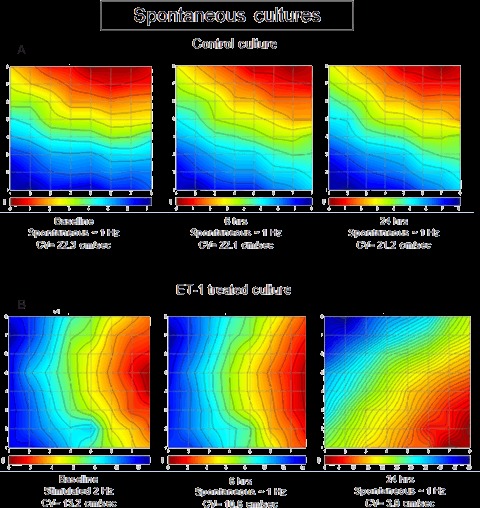
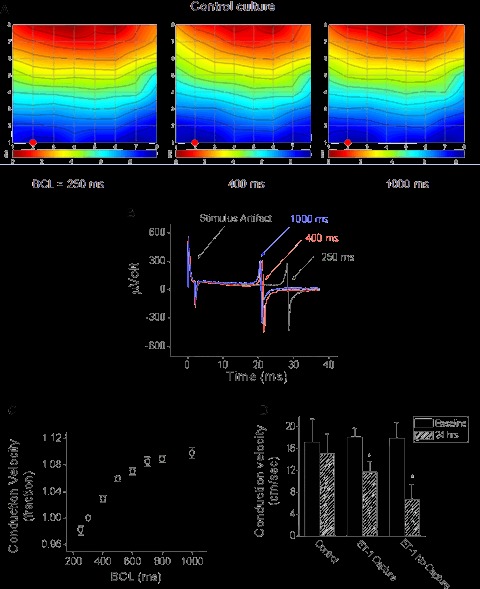
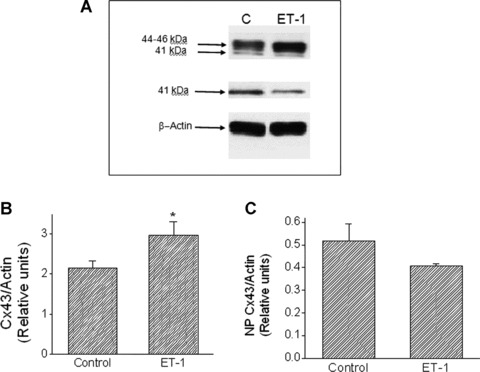
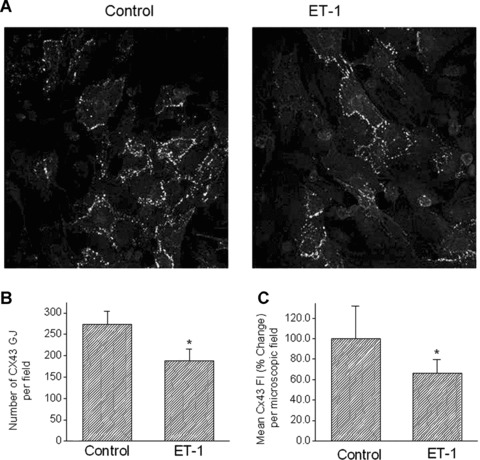
Endothelin-1 (ET-1) is an important contributor to ventricular hypertrophy and failure, which are associated with arrhythmogenesis and sudden death. To elucidate the mechanism(s) underlying the arrhythmogenic effects of ET-1 we tested the hypothesis that long-term (24 hrs) exposure to ET-1 impairs impulse conduction in cultures of neonatal rat ventricular myocytes (NRVM). NRVM were seeded on micro-electrode-arrays (MEAs, Multi Channel Systems, Reutlingen, Germany) and exposed to 50 nM ET-1 for 24 hrs. Hypertrophy was assessed by morphological and molecular methods. Consecutive recordings of paced activation times from the same cultures were conducted at baseline and after 3, 6 and 24 hrs, and activation maps for each time period constructed. Gap junctional Cx43 expression was assessed using Western blot and confocal microscopy of immunofluorescence staining using anti-Cx43 antibodies. ET-1 caused hypertrophy as indicated by a 70% increase in mRNA for atrial natriuretic peptide (P < 0.05), and increased cell areas (P < 0.05) compared to control. ET-1 also caused a time-dependent decrease in conduction velocity that was evident after 3 hrs of exposure to ET-1, and was augmented at 24 hrs, compared to controls (P < 0.01). ET-1 increased total Cx43 protein by approximately 40% (P < 0.05) without affecting non- phosphorylated Cx43 (NP-Cx43) protein expression. Quantitative confocal microscopy showed a approximately 30% decrease in the Cx43 immunofluorescence per field in the ET-1 group (P < 0.05) and a reduced field stain intensity (P < 0.05), compared to controls. ET-1-induced hypertrophy was accompanied by reduction in conduction velocity and gap junctional remodelling. The reduction in conduction velocity may play a role in ET-1 induced susceptibility to arrhythmogenesis.
Figures
Similar articles
-
Gap junctional remodeling by hypoxia in cultured neonatal rat ventricular myocytes.Cardiovasc Res. 2005 Apr 1;66(1):64-73. doi: 10.1016/j.cardiores.2005.01.014. Cardiovasc Res. 2005. PMID: 15769449
-
Hypoxia causes connexin 43 internalization in neonatal rat ventricular myocytes.Gen Physiol Biophys. 2010 Sep;29(3):222-33. doi: 10.4149/gpb_2010_03_222. Gen Physiol Biophys. 2010. PMID: 20817946
-
Effects of angiotensin II on expression of the gap junction channel protein connexin43 in neonatal rat ventricular myocytes.J Am Coll Cardiol. 1998 Sep;32(3):800-7. doi: 10.1016/s0735-1097(98)00317-9. J Am Coll Cardiol. 1998. PMID: 9741530
-
Is the junctional uncoupling elicited in rat ventricular myocytes by some dephosphorylation treatments due to changes in the phosphorylation status of Cx43?Eur Biophys J. 2004 May;33(3):201-10. doi: 10.1007/s00249-003-0381-0. Epub 2004 Jan 27. Eur Biophys J. 2004. PMID: 14745523 Review.
-
Gap junctional connexins in the developing mouse cardiac conduction system.Novartis Found Symp. 2003;250:80-98; discussion 98-109, 276-9. doi: 10.1002/0470868066.ch6. Novartis Found Symp. 2003. PMID: 12956325 Review.
Cited by
-
Endothelin-1 stimulates the expression of L-type Ca2+ channels in neonatal rat cardiomyocytes via the extracellular signal-regulated kinase 1/2 pathway.J Membr Biol. 2013 Apr;246(4):343-53. doi: 10.1007/s00232-013-9538-7. Epub 2013 Apr 2. J Membr Biol. 2013. PMID: 23546014
-
Big endothelin-1 as a clinical marker for ventricular tachyarrhythmias in patients with post-infarction left ventricular aneurysm.Anatol J Cardiol. 2019 Nov;22(5):256-261. doi: 10.14744/AnatolJCardiol.2019.67862. Anatol J Cardiol. 2019. PMID: 31674930 Free PMC article.
-
On the different roles of AT1 and AT2 receptors in stretch-induced changes of connexin43 expression and localisation.Pflugers Arch. 2012 Nov;464(5):535-47. doi: 10.1007/s00424-012-1161-4. Epub 2012 Sep 25. Pflugers Arch. 2012. PMID: 23007463
-
Cardiomyocytes derived from human embryonic and induced pluripotent stem cells: comparative ultrastructure.J Cell Mol Med. 2011 Nov;15(11):2539-51. doi: 10.1111/j.1582-4934.2011.01417.x. J Cell Mol Med. 2011. PMID: 21883888 Free PMC article.
-
Mechanoelectrical remodeling and arrhythmias during progression of hypertrophy.FASEB J. 2010 Feb;24(2):451-63. doi: 10.1096/fj.09-136622. Epub 2009 Oct 13. FASEB J. 2010. PMID: 19825979 Free PMC article.
References
-
- Kannel WB. Left ventricular hypertrophy as a risk factor: the Framingham experience. J Hypertens Suppl. 1991;9:S3–8. - PubMed
-
- Messerli FH, Soria F. Hypertension, left ventricular hypertrophy, ventricular ectopy, and sudden death. Am J Med. 1992;93:21S–26S. - PubMed
-
- Bril A, Forest MC, Gout B. Ischemia and reperfusion-induced arrhythmias in rabbits with chronic heart failure. Am J Physiol. 1991;261:301–7. - PubMed
-
- Winterton SJ, Turner MA, O'Gorman DJ, Flores NA, Sheridan DJ. Hypertrophy causes delayed conduction in human and guinea pig myocardium: accentuation during ischaemic perfusion. Cardiovasc Res. 1994;28:47–54. - PubMed
-
- Ito H, Hiroe M, Hirata Y, Fujisaki H, Adachi S, Akimoto H, Ohta Y, Marumo F. Endothelin ETA receptor antagonist blocks cardiac hypertrophy provoked by hemodynamic overload. Circulation. 1994;89:2198–203. - PubMed
Publication types
MeSH terms
Substances
Grants and funding
LinkOut - more resources
Full Text Sources
Other Literature Sources
Miscellaneous
