Review
. 2009 May;7(5):383-92.
doi: 10.1038/nrmicro2056.

Using movies to analyse gene circuit dynamics in single cells

Affiliations
Review

Using movies to analyse gene circuit dynamics in single cells

James C W Locke et al. Nat Rev Microbiol. 2009 May.

Abstract

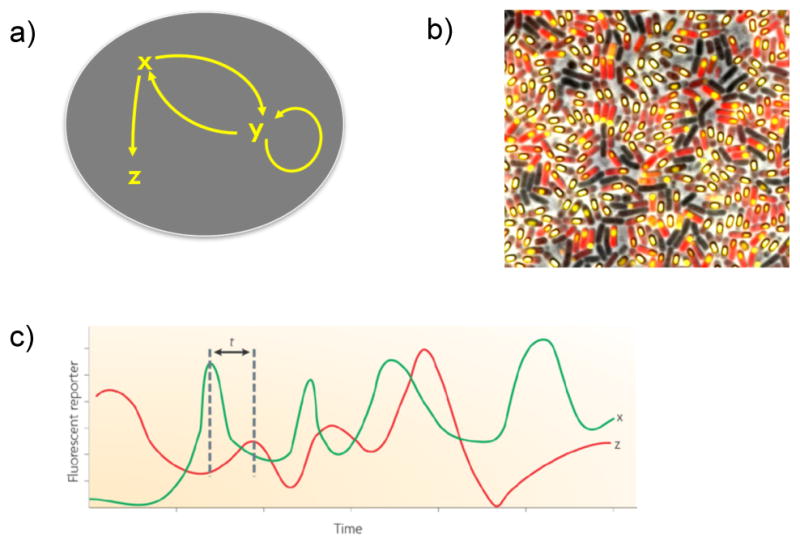
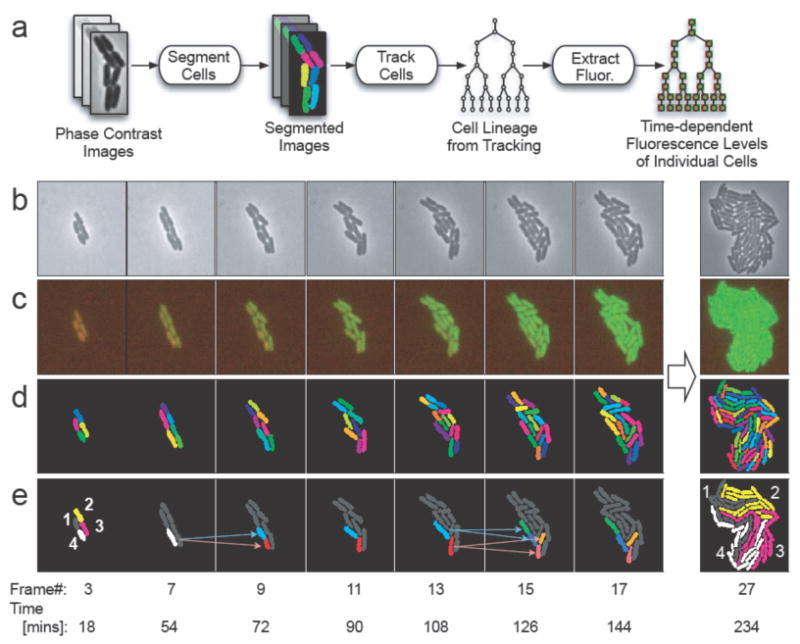
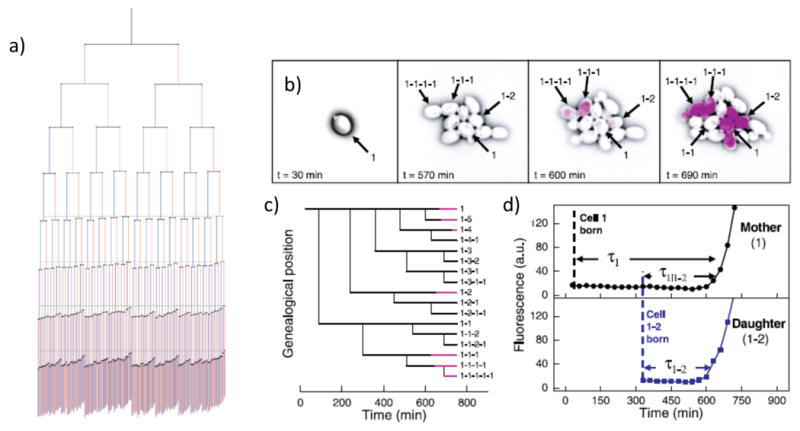
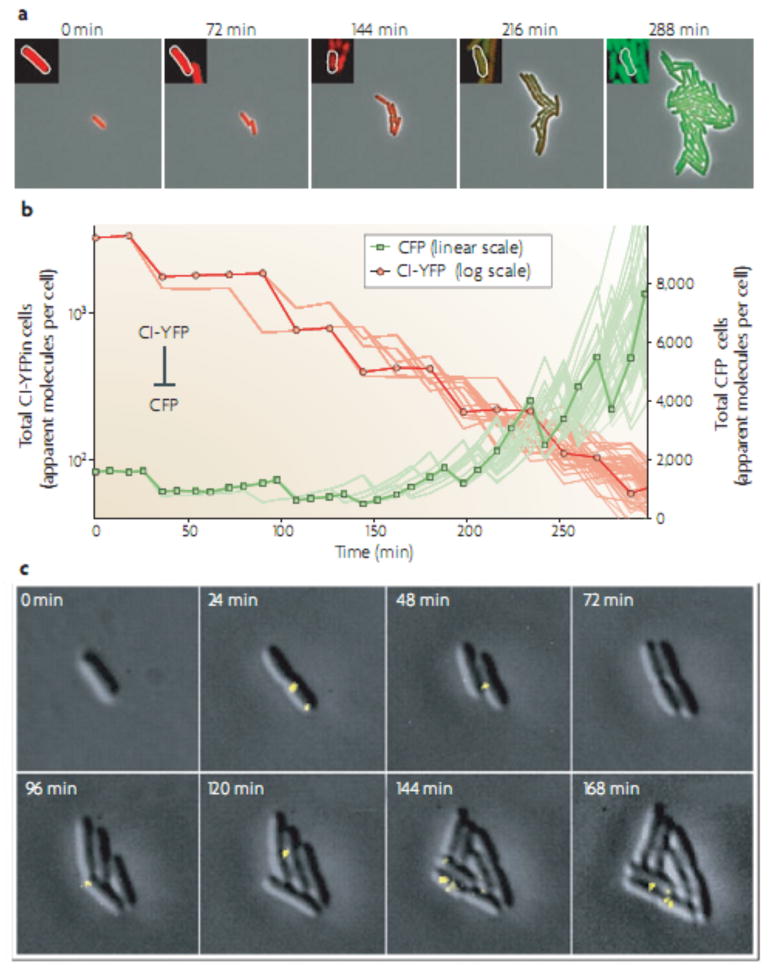
Many bacterial systems rely on dynamic genetic circuits to control crucial biological processes. A major goal of systems biology is to understand these behaviours in terms of individual genes and their interactions. However, traditional techniques based on population averages 'wash out' crucial dynamics that are either unsynchronized between cells or are driven by fluctuations, or 'noise', in cellular components. Recently, the combination of time-lapse microscopy, quantitative image analysis and fluorescent protein reporters has enabled direct observation of multiple cellular components over time in individual cells. In conjunction with mathematical modelling, these techniques are now providing powerful insights into genetic circuit behaviour in diverse microbial systems.


Figures

Figure 1
Figure 1. Circuits, variability, and movies
A) Circuit level view: genes and gene products interact to generate an ordered behavioural program. B) Noisy view: Isogenic populations exhibit large degrees of heterogeneity, both in terms of gene expression and differentiated states. As an example, we show an image of a B. subtilis strain with two chromosomally integrated reporter constructs, PspoIIq-cfp (shown in yellow), PspoIID-yfp (shown in red), superimposed on a phase contrast image (gray). Cells were grown in sporulation medium. However, they initiate sporulation at different times, leading vegetative cells (dark rods) to coexist with cells various stages of sporulation (coloured cells). C) Movies allow us to analyse the effects of circuit interactions on the relative timing of gene expression in variable and dynamic circuits. Here, two schematic gene expression traces are shown in red and green for a simple activating interaction (x activates z). Note that the movie enables one to observe delayed correlations that would not be evident in snapshots. τ indicates a typical delay before regulatory effects of x are visible in z.
Figure 2
Figure 2. Tracking and segmenting single cells
A) Schematic of data flow for a cell tracking and segmentation system. During tracking cell shapes must first be identified in images (segmentation) and then tracked over time. Finally the fluorescence values must be extracted. B-E) Segmentation and tracking input and output: B) Phase-contrast images are obtained at time-intervals (shown at the bottom). C) Fluorescence images of the microcolony. In this example, filters for yellow and cyan fluorescent proteins are used (shown in red and green respectively). D) Segmentation, performed on the phase-contrast images, finds the locations of each cell in the image. Arbitrary colours are used for labelling. E) The descendents of cell #4, are shown highlighted. The final panel shows the descendants of each of the 4 initial cells after ≈ 4 generations. Figure is courtesy of J. Young, California Institute of Technology, California, USA, and N. Rosenfeld, Rosetta Genomics, Rehovot, Israel.
Figure 3
Figure 3. Automated lineage analysis reveals epigenetic states
A) The aging of Escherichia coli (from 22). This lineage tree depicts 9 generations of E. coli from 94 movies. The lengths of the lines connecting cells to their progeny are proportional to the average growth rate of that cell, so a shorter line represents a shorter growth rate. At each division, the cell inheriting the old pole is placed on the right side of the division pair, and shown in red, while new poles are placed on the left side of each pair, and shown in blue. Green lines indicate the point at which the first cell divides in the last four generations. B-D) Genealogical switching history in the Yeast Galactose system (from 29). The first cell in each movie is designated cell number 1 and sequential daughters of that cell 1–1, 1–2, 1–3. These daughter cells bud in turn, giving rise to cells 1-1-1, 1-1-2, 1-2-1, etc. (B) An initially OFF cell grows into a variegated microcolony. Beginning at 600 min, or 4 generations, several cells fluoresce almost simultaneously. This includes the mother-daughter pairs (1,1–2) and (1-1-1,1-1-1–1). Conspicuously, cell 1–1 does not switch for the duration of the movie, even though its mother, daughter, and closest sibling all do. (C) The family tree for colony in (B). Black lines indicate cells in the OFF state, whereas pink lines represent cells after they have switched to the ON state.(D) Fluorescent time courses for mother cell 1 and her daughter 1–2, showing each as they switch into the ON state.
Figure 4
Figure 4. In vivo Biochemistry
A-B) Measuring the gene regulation function (GRF) of a repressor-promoter interaction in individual E. coli cell lineages (from 78). Here, CI-YFP (lambda repressor fused to yellow fluorescent protein) represses expression of cyan fluorescent protein (CFP). In the regulator dilution experiment: Cells are transiently induced to express CI-YFP and then observed in time-lapse microscopy as repressor dilutes out during cell growth. Part A) shows a filmstrip of a typical experiment. CI-YFP is shown in red and CFP is shown in green. Part B) shows quantitation of the movie. CI-YFP levels decrease by dilution (red lines), eventually permitting expression of the cfp target gene (green lines). The darker lines correspond to the cell lineage shown in the insets to part A). C) Monitoring transcriptional bursts in single cells (from 46). Frames from film footage of the expression of Tsr-Venus under the control of a repressed lac promoter. Tsr-Venus expression is shown in yellow and is overlaid with simultaneous DIC images (differential interference contrast) images (gray). Note the burst like expression pattern.
Figure 5
Figure 5. Circuit level Dynamics
A-C) Analysis of Bacillus subtilis competence circuit dynamics in individual cells (from51). Part A) shows a snapshot from a movie. PcomS expression is shown in green and PcomG expression is shown in red. The red cell is in the competent state (high ComK levels). White depicts spores or sporulating cells. Part b shows a quantitative time series of PcomS –yellow fluorescent protein (yfp) (green lines) and PcomG –cyan fluorescent protein (cfp) red lines) for the competence event shown in A). Note the anti-correlation in expression between the two promoters, which can be explained by the circuit diagram in part C. PcomS and PcomG activities obtained from the non-competent sister cell are shown in light green and light red, respectively. Part C) shows a map of the effective regulatory interactions in the core competence circuit in B. subtilis. The dashed inhibitory arrow depicts indirect repression. ComS competes with ComK for degradation by the MecA–ClpP–ClpC complex, effectively stabilizing ComK. D) The B. subtilis phosphorelay is required to generate variability in sporulation in B. subtilis (From 53). Time-lapse microscopy shows that heterogeneity in this system does not require the positive-feedback loop of Spo0A on itself (top row), but does require the activity of the phosphorelay (bottom row). Membranes are stained with FM5–95 (red), and expression of the sporulation reporter PspoIIA is shown in green. The insets show a close-up of the cells.

Similar articles

Cited by

References

    1. Marcus JS, Anderson WF, Quake SR. Microfluidic single-cell mRNA isolation and analysis. Anal Chem. 2006;78:3084–9. - PubMed
    1. Dickinson ME, Bearman G, Tille S, Lansford R, Fraser SE. Multi-spectral imaging and linear unmixing add a whole new dimension to laser scanning fluorescence microscopy. Biotechniques. 2001;31:1272, 1274–6, 1278. - PubMed
    1. Reddy GV, Heisler MG, Ehrhardt DW, Meyerowitz EM. Real-time lineage analysis reveals oriented cell divisions associated with morphogenesis at the shoot apex of Arabidopsis thaliana. Development. 2004;131:4225–37. - PubMed
    1. Megason SG, Fraser SE. Imaging in systems biology. Cell. 2007;130:784–95. - PubMed
    1. Liu AC, et al. Intercellular coupling confers robustness against mutations in the SCN circadian clock network. Cell. 2007;129:605–16. - PMC - PubMed

Publication types