. 2009 Jun;20(11):2673-83.
doi: 10.1091/mbc.e08-10-1061. Epub 2009 Apr 15.

Uncoupling stress granule assembly and translation initiation inhibition

Affiliations

Uncoupling stress granule assembly and translation initiation inhibition

Sophie Mokas et al. Mol Biol Cell. 2009 Jun.

Abstract

Cytoplasmic stress granules (SGs) are specialized regulatory sites of mRNA translation that form under different stress conditions known to inhibit translation initiation. The formation of SG occurs via two pathways; the eukaryotic initiation factor (eIF) 2alpha phosphorylation-dependent pathway mediated by stress and the eIF2alpha phosphorylation-independent pathway mediated by inactivation of the translation initiation factors eIF4A and eIF4G. In this study, we investigated the effects of targeting different translation initiation factors and steps in SG formation in HeLa cells. By depleting eIF2alpha, we demonstrate that reduced levels of the eIF2.GTP.Met-tRNAi(Met) ternary translation initiation complexes is sufficient to induce SGs. Likewise, reduced levels of eIF4B, eIF4H, or polyA-binding protein, also trigger SG formation. In contrast, depletion of the cap-binding protein eIF4E or preventing its assembly into eIF4F results in modest SG formation. Intriguingly, interfering with the last step of translation initiation by blocking the recruitment of 60S ribosome either with 2-(4-methyl-2,6-dinitroanilino)-N-methylpropionamideis or through depletion of the large ribosomal subunits protein L28 does not induce SG assembly. Our study identifies translation initiation steps and factors involved in SG formation as well as those that can be targeted without induction of SGs.


Figures

Figure 1.
Figure 1.
Inhibition of TC formation via NSC 119893 induces SG formation and occurs independently of eIF2 αphosphorylation. (A) HeLa cells were treated with 10 μM NSC 119893 for 60 min, fixed, permeabilized, and processed for immunofluorescence by using antibodies against different SG markers. Anti-Dcp1a antibodies were used to detect P-bodies. 4,6-Diamidino-2-phenylindole (Dapi) is used as nuclei marker. The percentage of cells harboring SGs (≥5 granules/cell), or P-bodies (PBs) (≥4 bodies/cell) is indicated to the right of the figure and is representative of the analysis of five different fields in three independent experiments for a total of 1000 cells counted. Pictures in the top and middle panels were taken using 40× objective. P-bodies pictures (bottom) were taken using a 60× oil immersion objective. (B) HeLa cells were treated with 10 μM NSC 119893 for 30 min and then incubated with [35S]methionine (50 μCi/ml) for another 30 min. Proteins were resolved by SDS-polyacrylamide gel, stained with Coomassie Blue (bottom), and detected by autoradiography (top). (C) HeLa cells were treated with 10 μM NSC 119893 or with 0.5 mM arsenite for 30 min, and the level of phospho-eIF2α was analyzed by Western blotting using antibodies specific to the phosphorylated form. Detection of the total levels of eIF2α is shown in the bottom panel and serves as a loading control. (D) WT and eIF2αS51A/S51A MEFs were treated with 10 μM NSC 119893 or with 0.5 mM arsenite for 30 min, and proteins were analyzed for the phosphorylation of eIF2α by Western blotting as described in C. (E) WT and eIF2αS51A/S51A MEFs were treated with 10 μM NSC 119893 for 60 min, and SGs were visualized as described above using anti-HuR and anti-FXR1 antibodies. The percentage of SGs formed in each cell line is indicated. (F) WT and eIF2αS51A/S51A MEFs were incubated with 10 μM NSC 119893 or with 0.5 mM arsenite for 30 min then with [35S]methionine (50 μCi/ml) for an additional 30 min. Proteins were prepared and analyzed as described in B.
Figure 2.
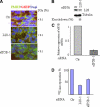
Figure 2.
Reducing eIF2α levels by siRNA induces SG formation. (A) Forty-eight hours after transfection with eIF2α-1 or control siRNA, HeLa cells were processed for immunofluorescence by using antibodies against FMRP, FXR1, eIF2α, and Dcp1a. The percentage of cells forming SGs (≥5 granules/cell) or P-bodies (≥4 bodies/cell) is indicated on the right and is representative of the analysis of five different fields in three independent experiments for a total of 1000 cells counted. eIF2α-depleted cells are indicated by arrows. Pictures in the top and middle panels were taken using 40× objective. P-bodies pictures (bottom) were taken using a 60× oil immersion objective. (B) Western blot analysis of proteins extracted from cells treated with eIF2α-1 or control siRNA. The membrane was incubated with anti-eIF2α (top) and as a control with eIF4E (bottom) antibodies. The percentage of eIF2α knockdown was determined by quantitation of the signal on films by using ImageQuant (GE Healthcare). (C) Knockdown of eIF2α inhibits translation in vivo. Forty-eight hours after treatment with eIF2α or control siRNA, cells were incubated 30 min with 50 μCi/ml [35S]methionine. The percentage of translation inhibition was measured by quantification of trichloroacetic acid-precipitable counts and represents the average of three independent experiments.
Figure 3.
Figure 3.
Depletion of eIF4B, eIF4H, or PABP induces SG formation, whereas depletion of eIF4E has a minimal effect on SG formation. (A) HeLa cells were treated with eIF4B-1, eIF4H-1, PABP-1, eIF4E-1, or with a control siRNA, and then processed for immunodetection of SGs by using anti-FMRP and anti-G3BP antibodies. The percentage of cells forming SGs (≥5 granules/cell) is indicated and is representative of three independent experiments for a total of 1000 cells counted. (B) HeLa cells were treated with siRNA PABP-1, eIF4E-1, or with a control siRNA. PABP-depleted cells (indicated by arrows) were visualized by immunofluorescence using anti-PABP antibodies, and the formation of SGs in these cells was detected with anti-FMRP antibodies. eIF4E-depleted cells (indicated with arrows) were detected using anti-eIF4E antibodies, and the absence of SGs in these cells was confirmed with anti-G3BP antibodies. (C and D) Western blot analysis of proteins extracted from cells treated with eIF4B-1, eIF4H-1, PABP-1, eIF4E-1, or siRNA control. (C) The membrane was incubated with the indicated antibodies and as a control with anti-tubulin (bottom) antibodies. (D) The membrane was incubated with anti-FMRP (top) and anti-G3BP (bottom) antibodies. (E) Depletion of eIF4B, eIF4H, PABP, or eIF4E reduces translation in vivo. After treatment with eIF4B-1, eIF4H-1, PABP-1, eIF4E-1, or control siRNA, cells were incubated 30 min with 50 μCi/ml [35S]methionine. The percentage of translation inhibition was measured by quantification of trichloroacetic acid-precipitable counts and represents the average of three independent experiments.
Figure 4.
Figure 4.
Chemical targeting of eIF4E weakly induces SG formation. (A) 4EGI-1 treatment inhibits cellular translation. HeLa cells were treated with 100 μM 4EGI-1 for 5 h and 30 min and then labeled with [35S] methionine (50 μCi/ml) for another 30 min. Proteins were resolved by SDS-polyacrylamide gel, stained with Coomassie Blue (bottom), and detected by autoradiography (top). (B) 4EGI-1 induces polysome disassembly. Cytoplasmic extracts of untreated (top) or 4EGI-1-treated HeLa cells (bottom) were prepared and fractionated on 10–60% sucrose gradients. The polysome profile was monitored by measuring the OD254. (C) HeLa cells were incubated with 100 μM 4EGI-1 for 6 h, fixed, permeabilized, and processed for immunofluorescence by using anti-SG marker antibodies as described above. Anti-Dcp1a antibodies were used to detect P-bodies. The percentage of cells harboring SGs (≥5 granules/cell), or P-bodies (PBs) (≥4 bodies/cell) is indicated to the right of the figure and is representative of the analysis of five different fields in three independent experiments for a total of 1000 cells counted. Pictures in the top and middle panels were taken using 40× objective. P-bodies pictures (bottom) were taken using a 60× oil immersion objective. (D) After a 6-h treatment with 100 μM 4EGI-1, cells were collected and proteins content was analyzed by Western blot for the expression of FMRP and G3BP by using the corresponding antibodies.
Figure 5.
Figure 5.
Depletion of L28 or eIF5B does not induce SG formation. (A) HeLa cells were treated with L28-1, eIF5B-1, or with a control siRNA, and then processed for immunodetection of SGs. (B) Western blot analysis of proteins extracted from cells treated with L28-1 or control siRNA. The membrane was incubated with the indicated antibodies (top) and as a control with anti-tubulin (bottom) antibodies. (C) qRT-PCR of eIF5B mRNA. After 48-h treatment of HeLa cells with eIF5B-1 or with a control siRNA, isolation of mRNAs, and preparation of cDNA, the amounts of eIF5B mRNAs relative to 18S rRNA was quantified by real time-PCR using the ΔΔCt method. The results are mean of triplicate measurements, with error bars corresponding to SEM. (D) Depletion of L28 or eIF5B reduces translation in vivo. After treatment with L28-1, eIF5B-1, or control siRNA, cells were incubated 30 min with 50 μCi/ml [35S]methionine. The percentage of translation inhibition was measured by quantification of trichloroacetic acid-precipitable counts and represents the average of three independent experiments for a total of 1000 cells counted.
Figure 6.
Figure 6.
SG formation occurs independently of the 60S recruitment step of translation initiation. (A) MDMP prevents the 80S formation. Krebs-2 extracts were preincubated with 100 μM MDMP and 0.6 mM cycloheximide (red line); with 50 μM NSC 119893 and 0.6 mM cycloheximide (brown line); with 100 μM MDMP, 0.6 mM cycloheximide, and 50 μM NSC 119893 (blue line); or with 100 μM inactive L-MDMP, 0.6 mM cycloheximide, and 50 μM NSC 119893 (yellow line) at 30°C for 5 min. Reactions were then mixed with 32P-radiolabeled CrPV IRES RNA and incubated for 10 min at 30°C. Complexes were sedimented by centrifugation through sucrose gradient. (B) MDMP inhibits cap-dependent and CrPV-mediated translation. Translations were performed with 10 μg/ml bicistronic Ren/CrPV/FF mRNA in the presence of [35S]methionine, D-MDMP, or L-MDMP at the indicated concentrations. Luciferase activity was measured with a luminometer. Error bars correspond to SEM of three independent experiments. (C) Cells were treated with 100 μM either D-MDMP or L-MDMP for 2 h or with 0.5 mM arsenite for 30 min, and proteins were analyzed by Western blotting using anti-phosho-eIF2α (top) or anti-eIF2α (bottom) antibodies (D) HeLa cells were treated with either 100 μM D-MDMP or L-MDMP or with 0.5 mM arsenite for 1 h and then incubated with [35S]methionine (50 μCi/ml) for another 60 min. (E) MDMP induces polysome disassembly. Cytoplasmic extracts of HeLa cells treated with 100 μM D-MDMP (bottom) or with 100 μM L-MDMP (top) were prepared and fractionated on 10–60% sucrose gradients. The polysome profile was monitored by measuring the OD254. (F) MDMP does not induce SGs. HeLa cells were treated with 100 μM MDMP for 2 h then processed for immunofluorescence to detect SGs and P-bodies, as described above. The percentage of cells harboring SGs (≥5 granules/cell), or P-bodies (PBs) (≥4 bodies/cell) is indicated to the right of the figure and is representative of the analysis of five different fields in three independent experiments for a total of 1000 cells counted. P-bodies pictures were taken using a 60× oil immersion objective. All other pictures were produced with a 40× objective. (G) Western blot analysis of FMRP and G3BP proteins after MDMP treatment.
Figure 7.
Figure 7.
MDMP does not affect SG assembly in HeLa cells. (A) HeLa cells were treated with 100 μM MDMP or 50 μg/ml cycloheximide for 2 h and then 0.5 mM arsenite was added for 30 min. Cells were subjected to immunofluorescence to visualize SGs and P-bodies (A) or harvested for polysome analysis (B). The percentage of cells harboring SGs (≥5 granules/cell), or P-bodies (PBs) (≥4 bodies/cell) is indicated to the right of the figure and is representative of the analysis of five different fields in three independent experiments for a total of 1000 cells counted.

Similar articles

Cited by

References

    1. Anderson P., Kedersha N. RNA granules. J. Cell Biol. 2006;172:803–808. - PMC - PubMed
    1. Anderson P., Kedersha N. Stress granules: the Tao of RNA triage. Trends Biochem. Sci. 2008;33:141–150. - PubMed
    1. Arimoto K., Fukuda H., Imajoh-Ohmi S., Saito H., Takekawa M. Formation of stress granules inhibits apoptosis by suppressing stress-responsive MAPK pathways. Nat. Cell Biol. 2008;10:1324–1332. - PubMed
    1. Baxter R., Knell V. C., Somerville H. J., Swain H. M., Weeks D. P. Effect of MDMP on protein synthesis in wheat and bacteria. Nat. New Biol. 1973;243:139–142. - PubMed
    1. Blume J. E., Shapiro D. J. Ribosome loading, but not protein synthesis, is required for estrogen stabilization of Xenopus laevis vitellogenin mRNA. Nucleic Acids Res. 1989;17:9003–9014. - PMC - PubMed

Publication types

MeSH terms

LinkOut - more resources