

Review
doi: 10.1002/jbio.200810018.
Microfluidics and photonics for Bio-System-on-a-Chip: a review of advancements in technology towards a microfluidic flow cytometry chip
Affiliations
- PMID: 19343660
- PMCID: PMC2746115
- DOI: 10.1002/jbio.200810018
Item in Clipboard
Review
Microfluidics and photonics for Bio-System-on-a-Chip: a review of advancements in technology towards a microfluidic flow cytometry chip
J Biophotonics.
2008 Oct.
Abstract
Microfluidics and photonics come together to form a field commonly referred to as 'optofluidics'. Flow cytometry provides the field with a technology base from which both microfluidic and photonic components be developed and integrated into a useful device. This article reviews some of the more recent developments to familiarize a reader with the current state of the technologies and also highlights the requirements of the device and how researchers are working to meet these needs.
Figures
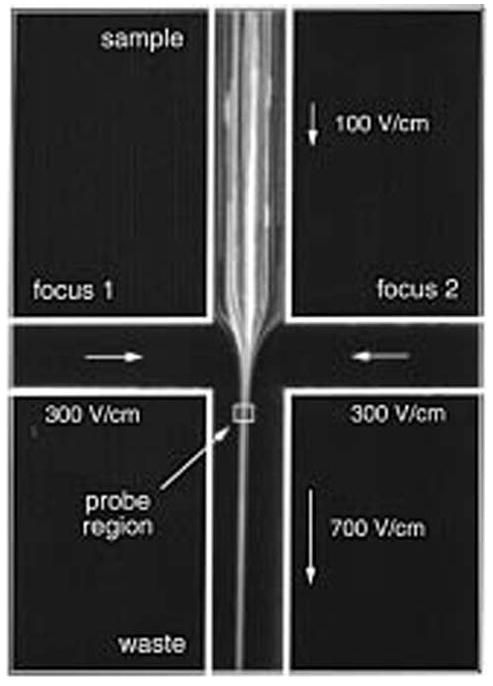
Time-integrated image (5 sec exposure time) showing the effects of electrokinetic focusing as electric field strengths of 100 and 300 V/cm are applied to sample and focusing (side) channels, respectively. The arrows represent both the direction of fluid movement and the relative fluid velocities in each channel. Reprinted with permission from [30].
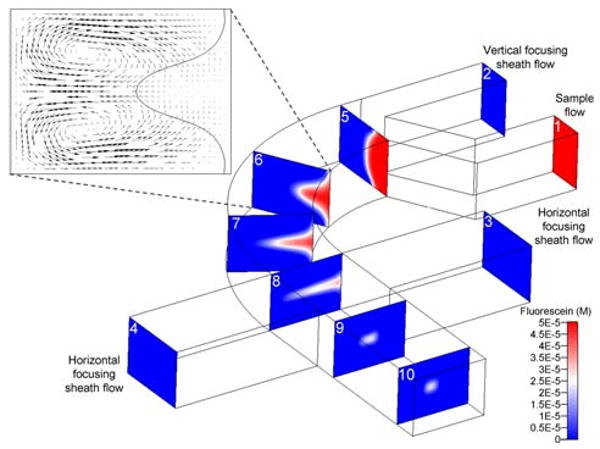
(online color at: www.biophotonics-journal.org ) Schematic of the 3D hydrodynamic focusing process by employing the “microfluidic drifting” technique. Slices 1–10 are the cross-sectional profiles of the fluorescein dye concentration in the focusing device. Inset: the simulation of the secondary flow velocity field shows the formation of Dean Vortices in the 90-degreee curve. An iso-curve of fluorescein concentration = 25 μM is arbitrarily chosen as the boundary of the sample flow [42].
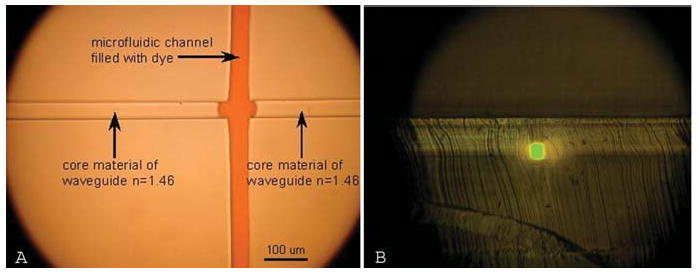
(online color at: www.biophotonics-journal.org ) (a) Pre-aligned monolithic waveguide perpendicular to the microfluidics channel, (b) emanating fluorescent light guided by PDMS waveguide of (a) (side view). The method was later modified to use completely separate waveguide and fluidic channels [51].
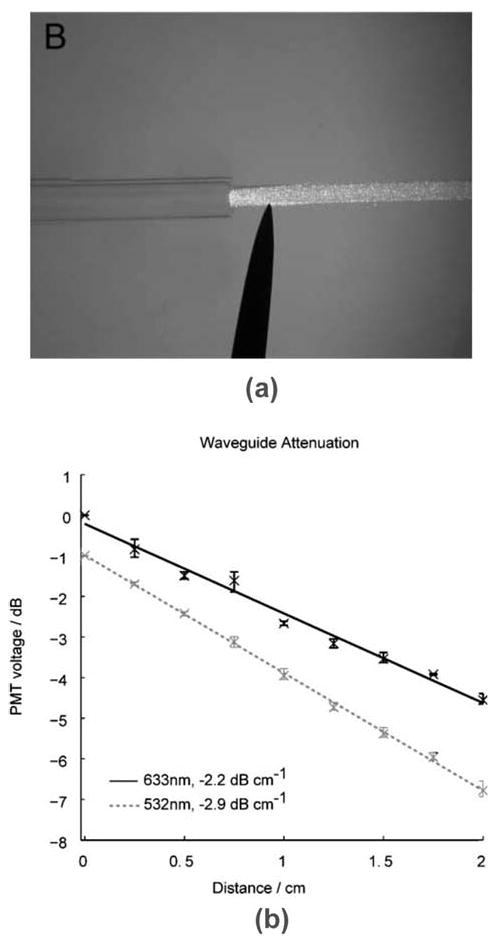
(a) Scattered light observed when a live fiber is inserted into the coupler (b) Plots of the normalized intensity along the PDMS waveguide demonstrating the propagation loss at 532 nm and 633 nm [46].
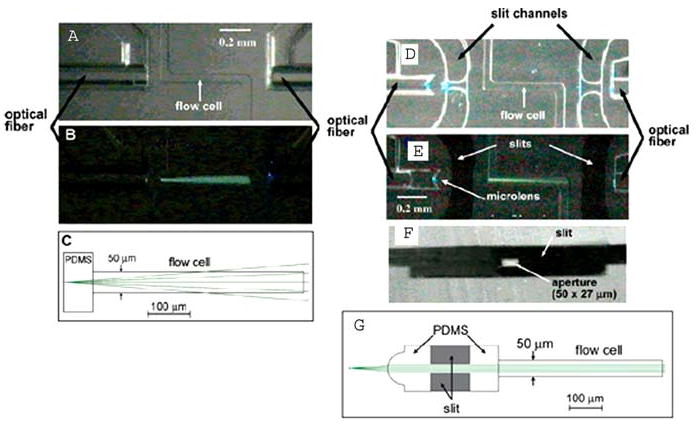
(online color at: www.biophotonics-journal.org ) Left: Ro et als Flow cell (a) illuminated only by a fiber optic (b), exhibiting divergence predicted by ray-tracing simulations (c). Right: A similar flow cell (d) with a lensed air space (microlens) at the end of the fiber. The microlens acts to collimate the light from the fiber (e) with the help of stray light blocking by the aperture (f), as expected from ray tracing simulations (g). The resulting smaller, more uniform interrogation beam would be desirable for uniform, localized excitation in flow cytometry chips. Reprinted with permission from [56].
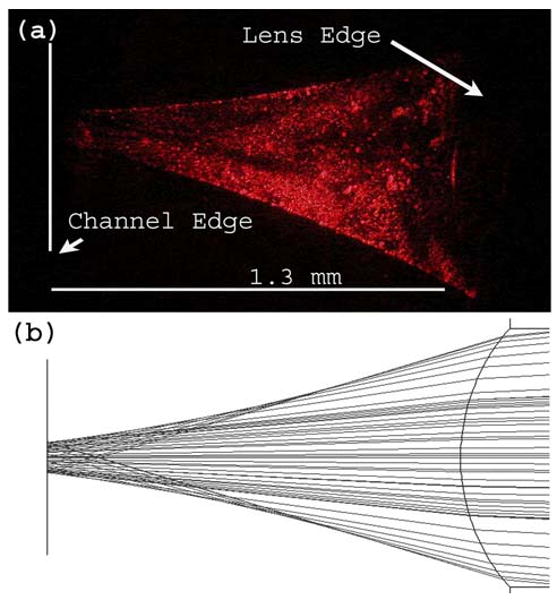
(online color at: www.biophotonics-journal.org ) Comparison of (a) an experimental image of a cylindrical lens in PDMS focusing light and (b) the simulated effects of the fluid-filled lens in PDMS [59]. Reprinted with permission from J. Godin, V. Lien, and Y. H. Lo, Applied Physics Letters, 89, 061106 (2006).
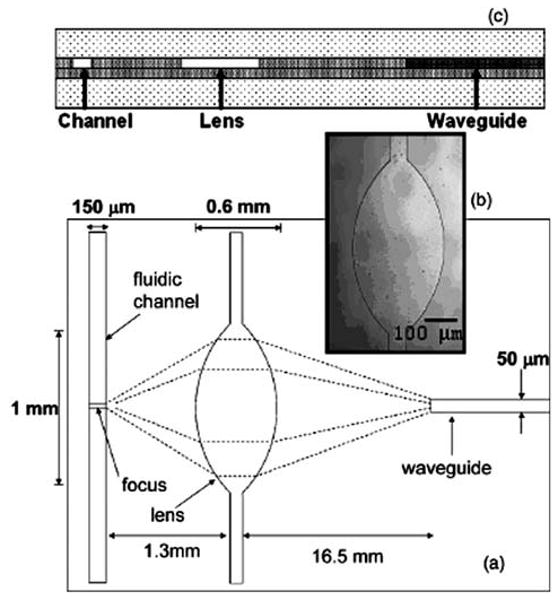
Schematic of a polymer chip (a) including a waveguide and a fluid filled lens (b). A side view (c) shows the three-layered device, with darkest shading representing the highest refractive index PDMS and the lightest shading representing the low-index cladding layers [59]. Reprinted with permission from J. Godin, V. Lien, and Y. H. Lo, Applied Physics Letters, 89, 061106 (2006).
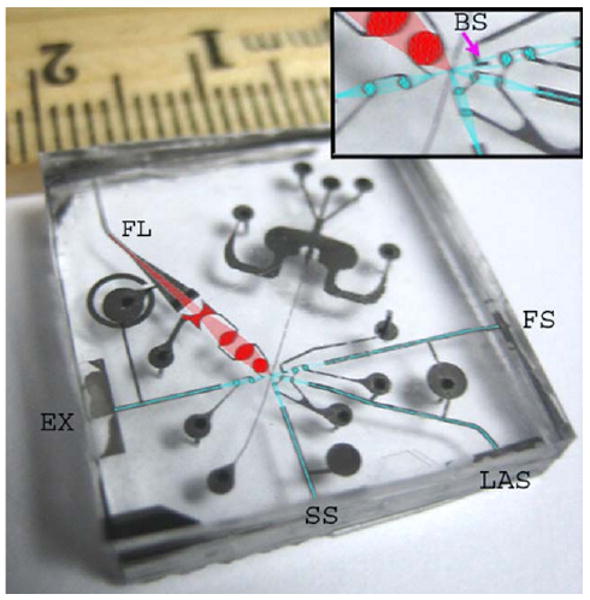
(online color at: www.biophotonics-journal.org ) Early prototype of a microfluidic cytometry chip including waveguides and lenses for an excitation source (EX), a forward scatter collection line (FS) including a beam stop (BS), a side scatter collection line (SS), a large-angle scatter collection line (LAS), and a line for fluorescence collection (FL) (unpublished). The seamless integration of fluidic and photonic elements is accomplished by simple microfabrication techniques [60].
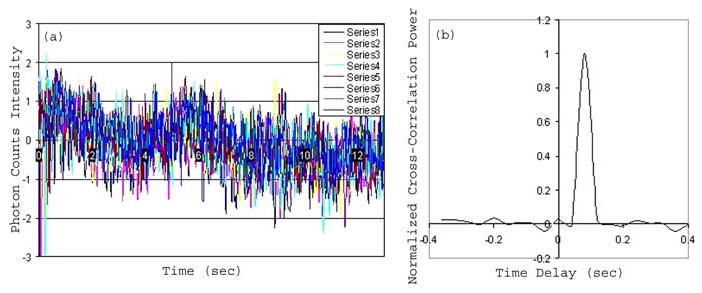
(online color at: www.biophotonics-journal.org ) Using time-delay cross-correlation, 8 noisy signals (a) are shifted and integrated to yield a single large peak (b) showing that a single 1 μm fluorescent bead has passed [73].
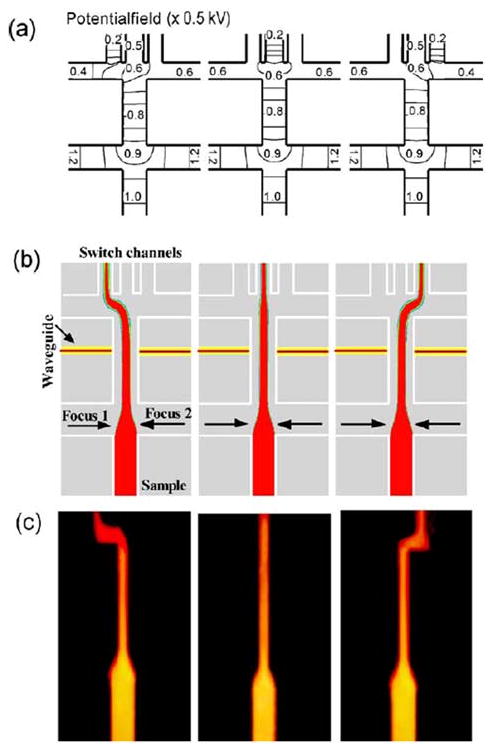
(online color at: www.biophotonics-journal.org ) a) Electric potential contour at 2 : 1 focusing ratio (e.g. ratio of voltage applied to focusing channel to sample channel). b) and c) show the numerical simulation and experimental results of the flow switching phenomena. Reprinted from [80] with permission from Elsevier.
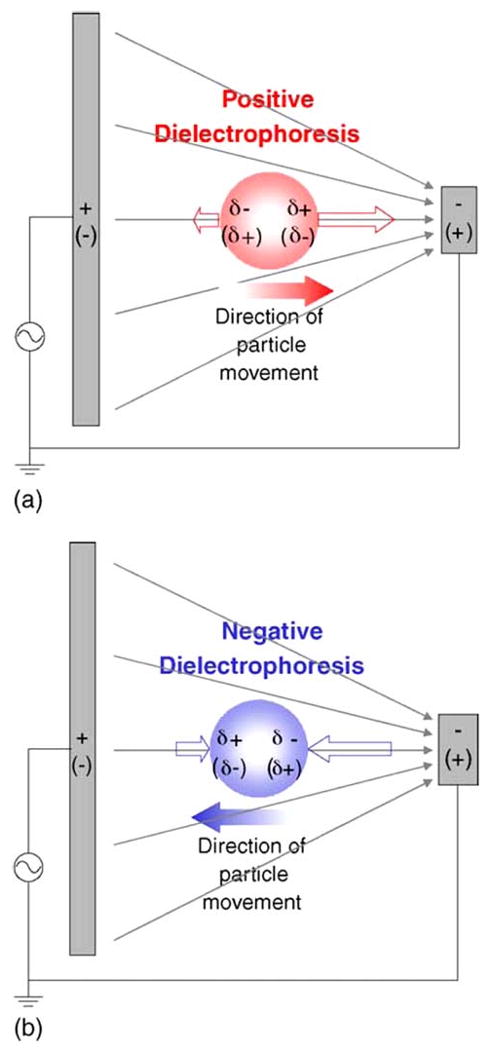
(online color at: www.biophotonics-journal.org ) Particles/cells suspended in an inhomogeneous electric field undergoing a) positive dielectrophoresis (pDEP) and b) negative dielectrophoresis (nDEP) will move to regions of high electric field and low electric field respectively. Whether the particles are pDEP/nDEP-activated depend on the relative polarizability between the particle and the surrounding medium. Reprinted from [94] with permission from Elsevier.
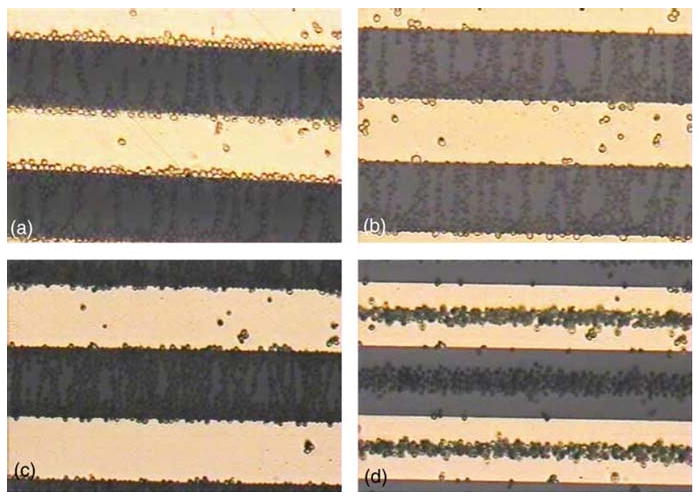
(online color at: www.biophotonics-journal.org ) Bands of yeast cell aggregations under 8 Vp-p at sinusoidal frequencies of a) 10 kHz and b) 5 MHz for viable yeast cells and c) 10 kHz and d) 5 MHz for nonviable yeast cells. The bright and dark regions are electrodes and glass substrate respectively, and the cells are immersed in a 5 μS/cm buffer fluid. Reprinted from [94] with permission from Elsevier.
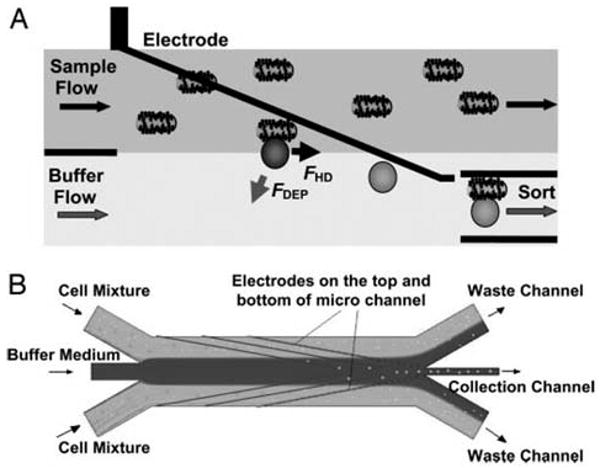
Sorting mechanism for the DACS. A) Bead-labeled cells experience significantly higher nDEP force than non-labeled cells and therefore, can overcome hydrodynamic drag forces resulting in transversal movement down to the collection channel. B) Schematic view of angled electrodes, inlet channels (e.g. buffer fluid sandwiched by two sample channels), and outlet collection and waste channels [96].
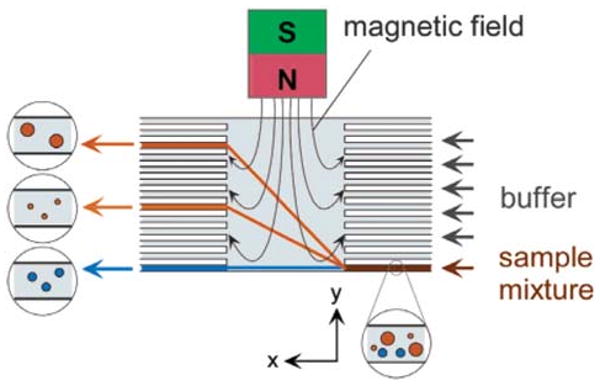
(online color at: www.biophotonics-journal.org ) Schematic of free-flow magnetophoresis. Particles in the magnetic field deviate from their original directions as a magnetic field is applied in the direction a laminar flow. This deviation depends on the size and magnetic susceptibility of each particle [103].
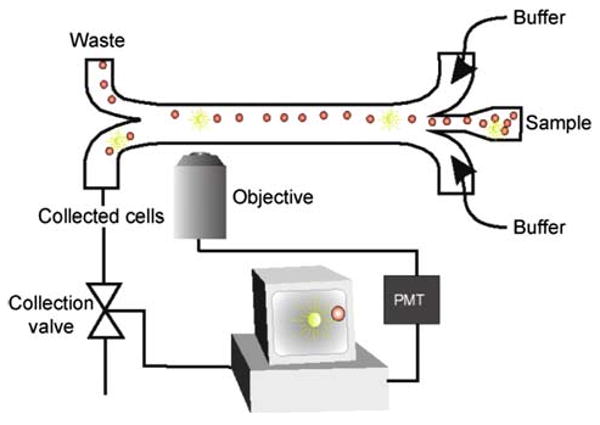
(online color at: www.biophotonics-journal.org ) Schematics of high-throughput μFACS. Activation of external collection valve (i.e. triggered by upstream fluorescent detection signal) draws out a fixed fluid volume, which contains the targeted cells, into the collection channel [36].
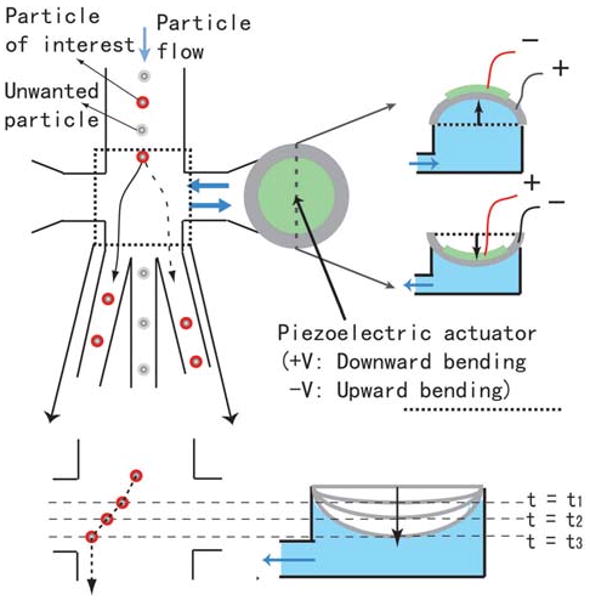
(online color at: www.biophotonics-journal.org ) Working principle of the piezoelectric (PZT) actuation-based sorter. The particles/cells are deflected down to the collection channels (left or right channels) as PZT actuator bends upward/downward. The transverse movement of particles is caused by the drag force of the fluid displaced by the PZT actuator as it bends (unpublished).
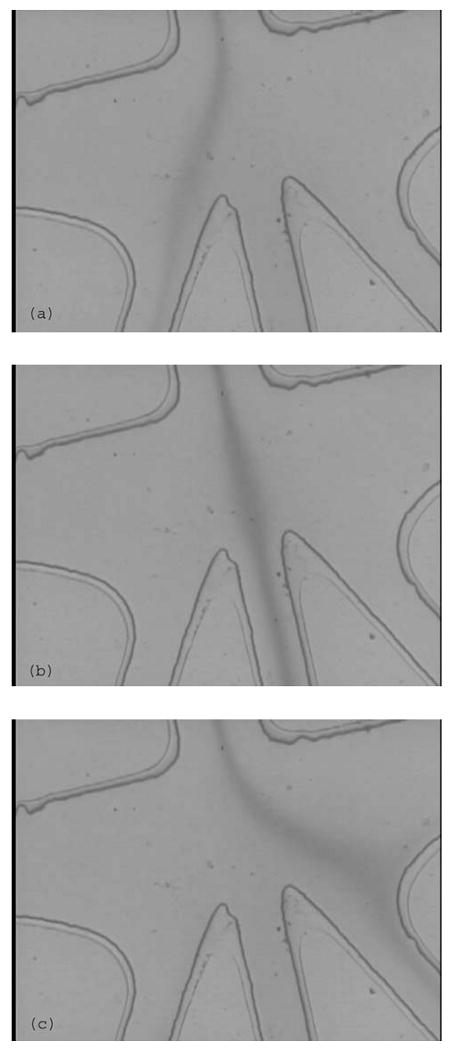
Images showing the flow-switching capabilities of the PZT-based sorter. The flow stream (Rhodamine 6G) switches (a) to the left and (c) to the right as PZT actuator becomes positively (e.g. downward bending) and negatively biased (e.g. upward bending), respectively. During the non-ramping state (i.e. the actuation-off state), the flow stream returns (b) to the central region and exits down to the waste channel (unpublished).
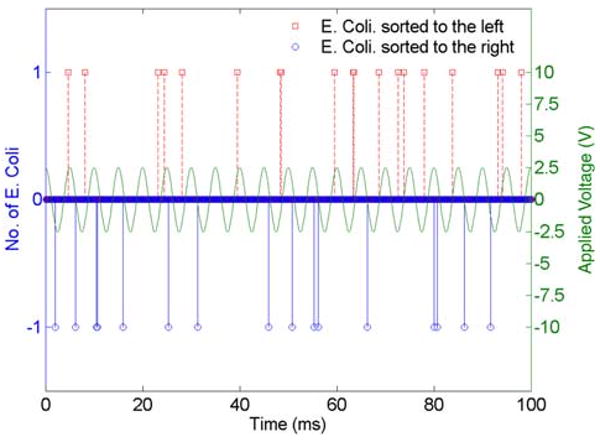
(online color at: www.biophotonics-journal.org ) Results from the sorting of single E. Coli. cells at 200 Hz frequency under 5 Vp-p actuation voltage. The peaks are obtained by identifying cells visually as they are sorted to the left or right collection channels. A total of 330 cells are visually counted in 1 sec. Note that some rare peaks which appear denser mean that two cells have exited a particular collection channel at roughly the same time. Also note that time at which cells are sorted to the left or right correspond to the downward or upward (bending) ramping state; that is, these events correspond to the upward or downward slope of the applied signal on the PZT actuator, consistent with the proposed mechanism of sorting (unpublished).
Similar articles
-
Recent advances in miniaturized microfluidic flow cytometry for clinical use.Electrophoresis. 2007 Dec;28(24):4511-20. doi: 10.1002/elps.200700620. Electrophoresis. 2007. PMID: 18008312 Review.
-
Microfluidics: Sorting particles with light.Nat Mater. 2004 Jan;3(1):9-10. doi: 10.1038/nmat1041. Nat Mater. 2004. PMID: 14704776 No abstract available.
-
Micro-optics for microfluidic analytical applications.Chem Soc Rev. 2018 Feb 19;47(4):1391-1458. doi: 10.1039/c5cs00649j. Chem Soc Rev. 2018. PMID: 29308474 Review.
-
Developing optofluidic technology through the fusion of microfluidics and optics.Nature. 2006 Jul 27;442(7101):381-6. doi: 10.1038/nature05060. Nature. 2006. PMID: 16871205 Review.
-
On-chip flow cytometer using integrated photonics for the detection of human leukocytes.Sci Rep. 2024 May 20;14(1):10921. doi: 10.1038/s41598-024-60708-0. Sci Rep. 2024. PMID: 38769346 Free PMC article.
Cited by
-
Optofluidic device for label-free cell classification from whole blood.Lab Chip. 2012 Oct 7;12(19):3791-7. doi: 10.1039/c2lc40560a. Lab Chip. 2012. PMID: 22875178 Free PMC article.
-
Review Article: Recent advancements in optofluidic flow cytometer.Biomicrofluidics. 2010 Dec 30;4(4):43001. doi: 10.1063/1.3511706. Biomicrofluidics. 2010. PMID: 21267434 Free PMC article.
-
Review: imaging technologies for flow cytometry.Lab Chip. 2016 Nov 29;16(24):4639-4647. doi: 10.1039/c6lc01063f. Lab Chip. 2016. PMID: 27830849 Free PMC article. Review.
-
Applying an optical space-time coding method to enhance light scattering signals in microfluidic devices.Biomicrofluidics. 2011 Sep;5(3):34116-341166. doi: 10.1063/1.3624740. Epub 2011 Aug 16. Biomicrofluidics. 2011. PMID: 21915241 Free PMC article.
-
Optofluidic Tomography on a Chip.Appl Phys Lett. 2011 Apr 18;98(16):161109. doi: 10.1063/1.3548564. Epub 2011 Apr 20. Appl Phys Lett. 2011. PMID: 21580801 Free PMC article.
References
-
- Chen H, Meiners JC. Applied Physics Letters. 2004;84:2193.
-
- Beebe DJ, Mensing GA, Walker GM. Annual Review of Biomedical Engineering. 2002;4:261. - PubMed
-
- Groisman A, Enzelberger M, Quake SR. Microfluidic Memory and Control Devices. American Association for the Advancement of Science. 2003;300:955. - PubMed
-
- Urbanski JP, Thies W, Rhodes C, Amarasinghe S, Thorsen T. Lab on a Chip. 2006;6:96. - PubMed
-
- Prakash M, Gershenfeld N. Science. 2007;315:832. - PubMed
Publication types
MeSH terms
Grants and funding
LinkOut - more resources
Full Text Sources
Other Literature Sources
