. 2009 Apr;27(4):361-8.
doi: 10.1038/nbt.1533. Epub 2009 Mar 29.

Targeted and genome-scale strategies reveal gene-body methylation signatures in human cells

Affiliations

Targeted and genome-scale strategies reveal gene-body methylation signatures in human cells

Madeleine P Ball et al. Nat Biotechnol. 2009 Apr.

Erratum in

  • Nat Biotechnol. 2009 May;27(5):485

Abstract

Studies of epigenetic modifications would benefit from improved methods for high-throughput methylation profiling. We introduce two complementary approaches that use next-generation sequencing technology to detect cytosine methylation. In the first method, we designed approximately 10,000 bisulfite padlock probes to profile approximately 7,000 CpG locations distributed over the ENCODE pilot project regions and applied them to human B-lymphocytes, fibroblasts and induced pluripotent stem cells. This unbiased choice of targets takes advantage of existing expression and chromatin immunoprecipitation data and enabled us to observe a pattern of low promoter methylation and high gene-body methylation in highly expressed genes. The second method, methyl-sensitive cut counting, generated nontargeted genome-scale data for approximately 1.4 million HpaII sites in the DNA of B-lymphocytes and confirmed that gene-body methylation in highly expressed genes is a consistent phenomenon throughout the human genome. Our observations highlight the usefulness of techniques that are not inherently or intentionally biased towards particular subsets like CpG islands or promoter regions.


Figures
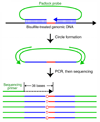
Figure 1
Figure 1. BSPP technology enabling accurate measurement of methylation levels
a, BSPP experimental scheme. Two hybridizing locus-specific “arms” (blue) are connected by a 50bp common “backbone” sequence (green). In this work, ~10,000 BSPPs were designed to target CpG sites in bisulfite-treated DNA with a CpG located at the 3' end of the 10 bp polymerized span (red). Circles were formed by addition of polymerase, dNTP, and ligase, and were subsequently amplified using the backbone sequence as primers. Sequencing was then performed using an Illumina Genome Analyzer with a primer matching the backbone sequence; 28 bases of arm sequence were read through before sequencing informative positions within the span (read lengths were 36 bases in total). b, Correlation of methylation level in the technical replicates (Pearson coefficient r = 0.965). c, Correlation of BSPP methylation with the methylation levels determined by bisulfite PCR followed by Sanger sequencing at 33 locations (r = 0.966). Error bars (in green) represent the standard deviation of methylation as measured by Sanger sequencing.
Figure 2
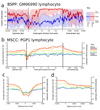
Figure 2. Methylation vs gene positions, split by gene expression level
a, Running median methylation vs. gene position for high and low expression genes in ENCODE pilot regions of the GM06990 cell line (based on BSPP data). b–d are based on MSCC data and share the same key. b, Running average MSCC HpaII observations vs. gene position for all genes in the PGP1 EBV-transformed lymphoblastoid cell line, and split into five groups based on expression level. Contribution of each MSCC data point was normalized for local CpG density, MspI control counts and, for sites within the gene, for gene length. c, Running average methylation vs. position relative to transcription start site (TSS). d, Running average methylation vs. position relative to transcriptional end of genes (for genes at least 15kb in length).
Figure 3
Figure 3. MSCC technology allowing accurate estimate of methylation levels
a, Scheme of generation of a methyl sensitive cut site library. (1) HpaII digestion cuts genomic DNA at all unmethylated CCGG sites only; (2) The first adapter containing an MmeI recognition site is ligated; (3) MmeI digestion cuts into the unknown genomic sequence to produce an 18–19 bp tag; (4) A second adapter is added by ligation; (5) The library is amplified and sequenced. The number of reads for a given site is correlated with the amount of digestion that occurs there and thus an indication of methylation level. b, BSPP methylation vs. MSCC counts data was grouped according to the BSPP-determined methylation levels into 20 bins, with each bin containing an equal number of data points. The mean number of counts (black points) is linearly related to the mean methylation of a bin (blue best fit line is shown). Green error bars represent the 95% confidence interval based on the standard error of the mean for bin. c, Summed MSCC counts for paired tag sites was binned according to show how well individual sites predict methylation. Horizontal bars represent median methylation as determined by BSPP, boxes represent the quartiles, and whiskers mark the 5th and 95th percentiles.
Figure 4
Figure 4. Promoter CpG density and methylation vs. gene expression
a, High CpG promoters (HCP, 65% of all promoters) tend to have low methylation regardless of expression (65% of promoters). b, Intermediate CpG promoters (ICP, 16% of promoters) tend to have low methylation when highly expressed and high methylation when lowly expressed. c, Low CpG promoters (LCP, 28% of promoters) tend to have high methylation regardless of gene expression.
Figure 5
Figure 5. Methylation profiles of individual genes
Individual genes are plotted according to the average MSCC HpaII counts found in the promoters (horizontal axis, −400 to +1000 relative to start) and gene bodies (vertical axis, between the gene end and +2000 relative to start). The color of each point reflects the expression level of that gene and points were plotted in a random order to avoid artifacts produced by non-random overlaps. Only genes with at least 10 data points in each region were used.

Comment in

  • Locking in on the human methylome.
    Berman BP, Weisenberger DJ, Laird PW. Berman BP, et al. Nat Biotechnol. 2009 Apr;27(4):341-2. doi: 10.1038/nbt0409-341. Nat Biotechnol. 2009. PMID: 19352369 No abstract available.

Similar articles

Cited by

References

    1. Suzuki MM, Bird A. DNA methylation landscapes: provocative insights from epigenomics. Nat Rev Genet. 2008;9:465–476. - PubMed
    1. Goll MG, Bestor TH. Eukaryotic cytosine methyltransferases. Annu Rev Biochem. 2005;74:481–514. - PubMed
    1. Feinberg AP, Tycko B. The history of cancer epigenetics. Nat Rev Cancer. 2004;4:143–153. - PubMed
    1. Jiang YH, Bressler J, Beaudet AL. Epigenetics and human disease. Annu Rev Genomics Hum Genet. 2004;5:479–510. - PubMed
    1. Clark SJ, Harrison J, Paul CL, Frommer M. High sensitivity mapping of methylated cytosines. Nucleic Acids Res. 1994;22:2990–2997. - PMC - PubMed

Publication types

Associated data