. 2009 Mar 26;61(6):852-64.
doi: 10.1016/j.neuron.2009.01.020.

Distinct roles of transcription factors brn3a and brn3b in controlling the development, morphology, and function of retinal ganglion cells

Affiliations

Distinct roles of transcription factors brn3a and brn3b in controlling the development, morphology, and function of retinal ganglion cells

Tudor C Badea et al. Neuron. .

Abstract

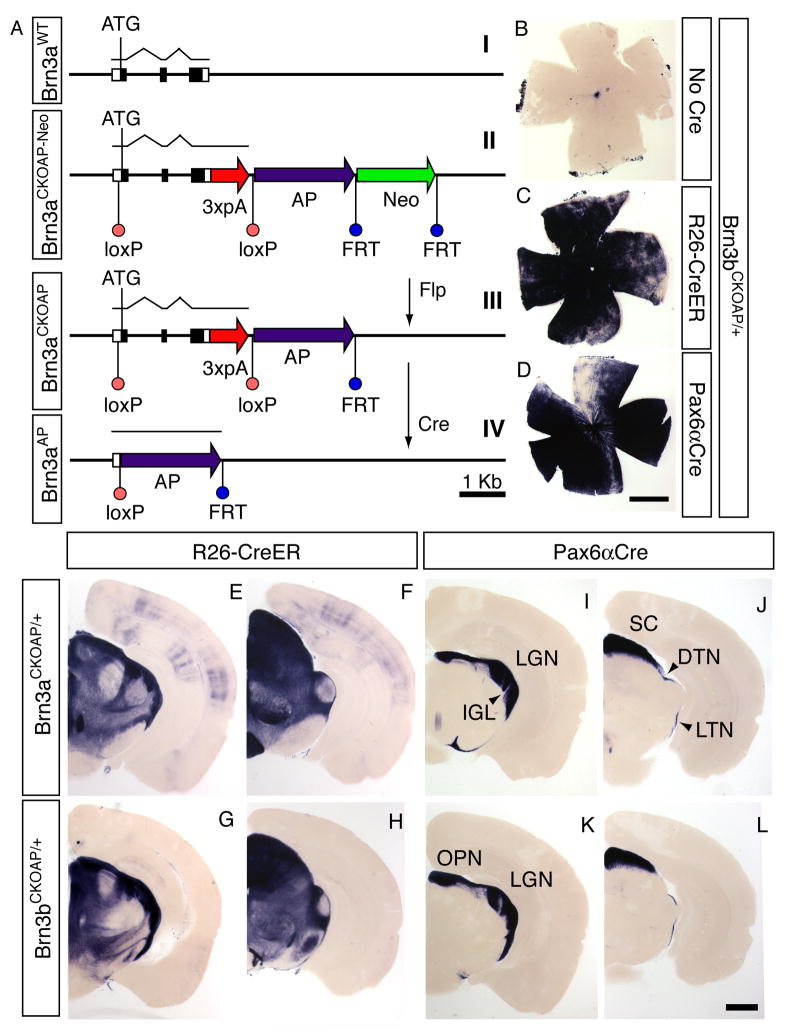
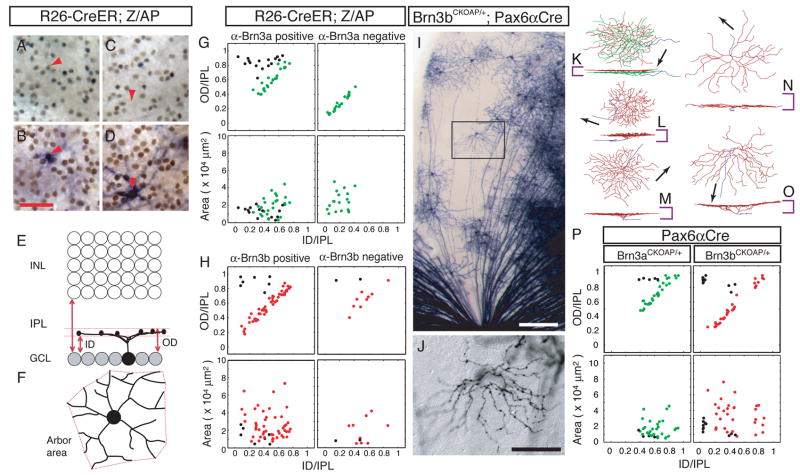
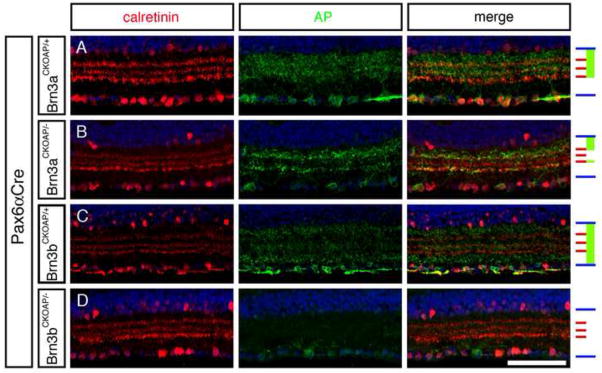
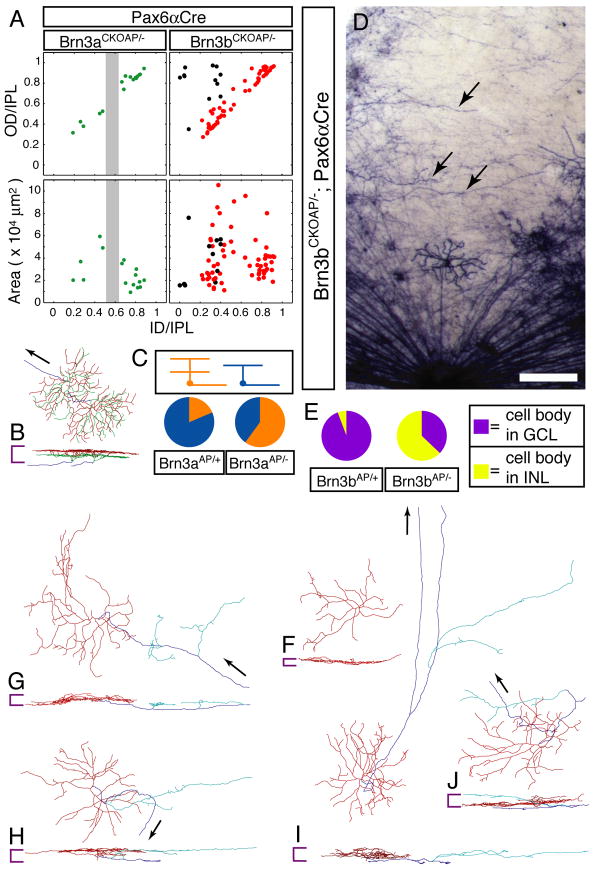
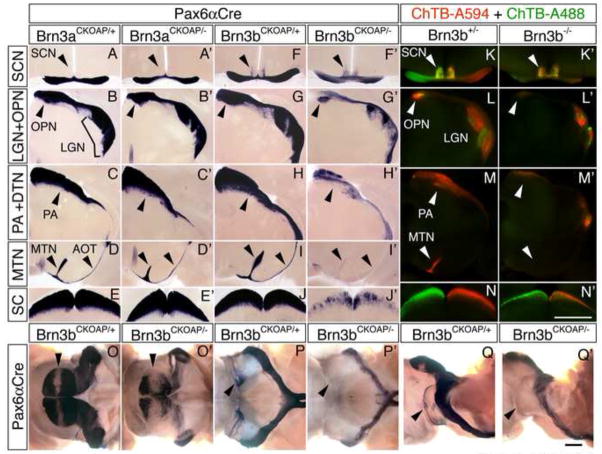
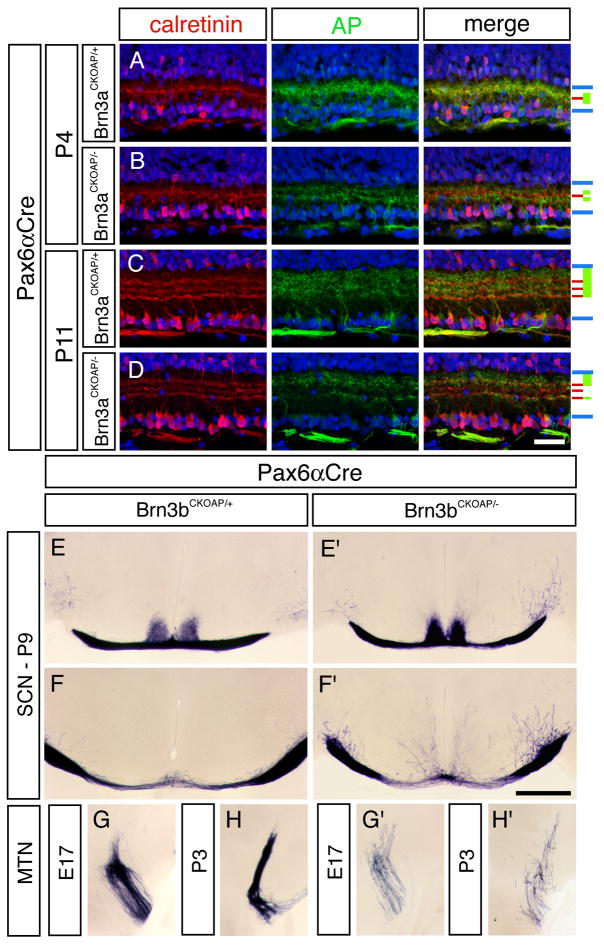
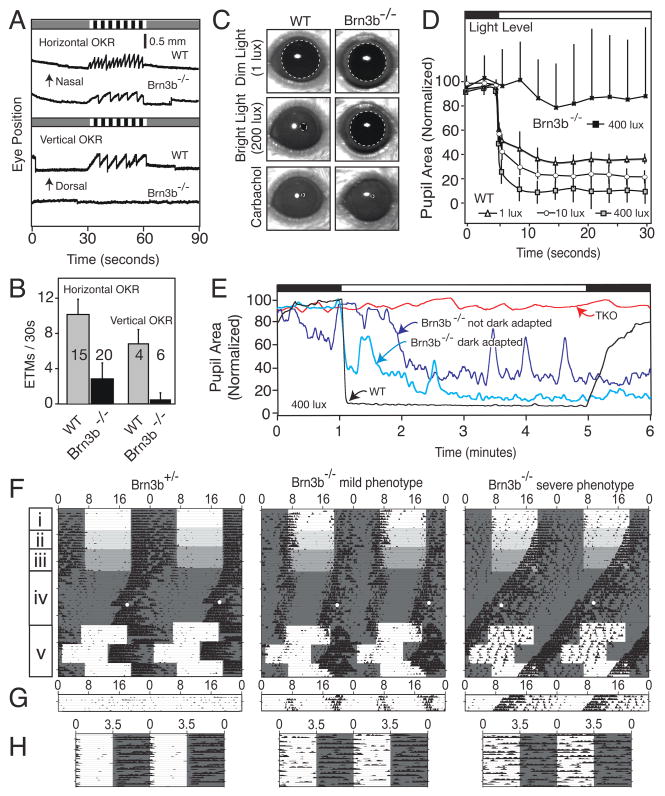
Transcriptional regulatory networks that control the morphologic and functional diversity of mammalian neurons are still largely undefined. Here we dissect the roles of the highly homologous POU-domain transcription factors Brn3a and Brn3b in retinal ganglion cell (RGC) development and function using conditional Brn3a and Brn3b alleles that permit the visualization of individual wild-type or mutant cells. We show that Brn3a- and Brn3b-expressing RGCs exhibit overlapping but distinct dendritic stratifications and central projections. Deletion of Brn3a alters dendritic stratification and the ratio of monostratified:bistratified RGCs, with little or no change in central projections. In contrast, deletion of Brn3b leads to RGC transdifferentiation and loss, axon defects in the eye and brain, and defects in central projections that differentially compromise a variety of visually driven behaviors. These findings reveal distinct roles for Brn3a and Brn3b in programming RGC diversity, and they illustrate the broad utility of germline methods for genetically manipulating and visualizing individual identified mammalian neurons.


Figures

Figure 1
Figure 1. Conditional targeting of the Brn3a and Brn3b loci
(A) Schematic of the conditional targeting strategy illustrated for Brn3a; an identical strategy was used for Brn3b. (I) the endogenous locus, (II) the targeted locus, (III) the targeted locus after Flp-mediated excision of the PGK-neo cassette, and (IV) the targeted locus after Cre-mediated excision of the Brn3a coding region, which places the AP coding region under the control of the Brn3a promoter. Filled black boxes, Brn3a coding region; open boxes, 5′ and 3′ UTRs. (B–D) flat mounted Brn3bCKOAP/+ retinas histochemically stained for AP activity: (B) in the absence of Cre, (C) with ROSA26-creER(T), and (D) with Pax6αCre. (E–L) Coronal brain sections (200 μm thickness) from (E,F,I,J) Brn3aCKOAP/+ or (G,H,K,L) Brn3bCKOAP/+ in the background of (E–H) ROSA26-CreER(T) or (I–L) Pax6αCre. The left and right members of each pair of sections (e.g. E and F) are at the level of the LGN and SC, respectively. The ROSA26-CreER(T) samples are from mice that had not been exposed to 4-hydroxytamoxifen, showing that the Brn3aCKOAP and Brn3bCKOAP loci exhibit a relatively high efficiency of Cre-mediated recombination. No AP-expressing cells were seen in the absence of a Cre or CreER gene. DTN, dorsal terminal nucleus; IGL, intergeniculate leaflet; LGN, lateral geniculate nucleus; LTN, lateral terminal nucleus; OPN, olivary pretectal nucleus; SC, superior colliculus. Scale bars in D and L, 1 mm.
Figure 2
Figure 2. The populations of Brn3a- and Brn3b-expressing RGCs have distinct distributions of dendritic stratification
(A–D) Anti-Brn3a immunoreactive (red arrowhead in A,B) and anti-Brn3a non-reactive (red arrow in C,D) RGC nuclei in flat mounts of R26-CreER(T);ZAP retinas. After HRP immunohistochemistry (A,C) the tissue was processed for AP histochemistry (B,D) and the same region rephotographed. The focal plane is in the GCL, and RGC dendrites in the IPL are out of focus. (E,F) Morphological parameters for the analysis of RGC dendritic arbors (Badea and Nathans, 2004; Badea et al., 2003). The inner distance (ID) and outer distance (OD), expressed as a fraction of IPL thickness, together define the level of stratification and arbor thickness. The arbor area is calculated as the area of the polygon (in red) with the shortest perimeter that connects the tips of the RGC dendritic arbor when projected in the plane of the retina. (G,H) Scatter plots of morphological parameters for monostratified Brn3a-positive, Brn3a-negative, Brn3b-positive and Brn3b-negative RGCs. RGCs with axon arbors thicker than 0.25 of the IPL thickness are coded by black symbols in this and all other scatter plots; red and green symbols represent RGCs with narrowly stratified arbors (<0.25 of the IPL thickness). (I,J) Brn3bAP/+ RGCs in the sparsely recombined zone of a flat mounted Brn3bCKOAP/+;Pax6αCre retina. The optic disc is at the bottom center. The enclosed region in I is shown at higher magnification in J; the digitized morphology of this cell is shown in O. Scale bars in I and J are 200 and 80 μm, respectively. (K–O) Digitized morphologies of AP-expressing RGCs from Brn3aCKOAP/+;Pax6αCre (K,L,M) and Brn3bCKOAP/+;Pax6αCre (N,O). For each cell, en face (top) and vertical views (bottom) are shown. Vertical and horizontal bars show, respectively, the thickness of the IPL and a 30 μm scale. Axons are shown in blue and arrows indicate the direction of the optic disc. For the bistratified cell in K, dendrites are shown in green (ON lamina) and red (OFF lamina). (P) Scatter plots of morphological parameters for monostratified Brn3aAP/+ RGCs from Brn3aCKOAP/+;Pax6αCre retinas and Brn3bAP/+ RGCs from Brn3bCKOAP/+;Pax6αCre retinas. A scatter plot of bistratified RGCs is shown in Supplementary Figure 2.
Figure 3
Figure 3. Vertical sections showing the inner retina immunostained for calretinin and AP reveal distinct stratification levels for dendrites of Brn3aAP/+ and Brn3bAP/+ RGCs, a loss of the centrally stratifying IPL dendrites in Brn3aAP/− RGCs, and a loss of most Brn3bAP/− RGCs
The GCL is at the bottom. Right, schematic showing, for each set of panels, the boundaries of the IPL (blue), the three calretinin-immunoreactive laminae (red), and the regions occupied by AP-immunoreactive RGC dendrites (green). Scale bar: 80 μm.
Figure 4
Figure 4. Brn3bAP/− RGCs have altered axonal and dendrite morphologies
(A) Scatter plots of Brn3aAP/− and Brn3bAP/− dendritic arbor parameters derived from single cell morphologies. In the Brn3aAP/− scatter plots, the gap centered at the ON/OFF boundary is indicated by a vertical grey bar. (B) Digitized morphologies of two adjacent and partly overlapping bistratified RGCs from a Brn3aCKOAP/−;Pax6αCre retina. (C) Pie charts showing the ratios of bistratified (orange):monostratified (blue) Brn3aAP RGCs in Brn3aCKOAP/+;Pax6αCre and Brn3aCKOAP/−;Pax6αCre retinas. (D) Sparsely recombined zone of a flat mounted Brn3bCKOAP/−;Pax6αCre retina showing circumferentially oriented fibers (arrowheads). The optic disc is at the bottom center. (E) Pie charts showing the ratios of Brn3bAP cell bodies in the INL (yellow):GCL (purple) in Brn3bCKOAP/+;Pax6αCre and Brn3bCKOAP/−;Pax6αCre retinas. (F–J) Digitized morphologies of Brn3bCKOAP/−;Pax6αCre RGCs. Color coding and symbols are as described for Figure 2, with the addition that neurites originating from axons and penetrating into the IPL are shown in light blue. The cell in (F) has no axon. Scale bar in D: 200 μm.
Figure 5
Figure 5. Decreased brain projections from Brn3bAP/− but not Brn3aAP/−RGCs
(A–J′) AP-stained RGC projections in the principal retinorecipient areas in coronal sections of adult brains from Brn3aCKOAP/+;Pax6αCre, Brn3aCKOAP/−; Pax6αCre, Brn3bCKOAP/+;Pax6αCre, and Brn3bCKOAP/−;Pax6αCre mice. From top to bottom: the optic chiasm and SCN, the LGN and anterior pretectal area (PA) containing the OPN, the posterior PA containing the NOT and DTN, the MTN and the inferior and lateral fascicles of the AOT, and the SC. The narrow unstained vertical zone within the LGN in panels B, B′, and G, and the wider zone in the LGN in G′, correspond to the area targeted by RGCs with cell bodies in the dorso-ventral stripe of retina that is weakly recombined in the Pax6αCre background. (K–N) RGC projections in the principal retinorecipient areas in coronal sections of adult brains from Brn3b+/− and Brn3b−/− mice injected with Alexa Fluor 594-conjugated Cholera toxin B in the left eye (red) and Alexa Flour 488-conjugated Cholera toxin B in the right eye (right). (O–Q′) AP-stained Brn3bCKOAP/+;Pax6αCre and Brn3bCKOAP/−;Pax6αCre intact midbrains in dorsal (O,O′), ventral (P,P′), and lateral (Q,Q′) views. Anterior is to the right. Arrowheads in O and O′: the coronal stripe of weak AP staining in the center of the SC corresponding to the target area of RGCs with cell bodies in the dorsoventral stripe of retina that is weakly recombined in the Pax6αCre background. Arrowheads in P and P′: the ventral aspect of the AOT. Arrowheads in Q and Q′: the LTN and lateral aspect of the AOT. Scale bars: 1 mm.
Figure 6
Figure 6. Development of IPL stratification by Brn3aAP/+ and Brn3aAP/− RGC dendrites and central projections by Brn3bAP/+ and Brn3bAP/− RGC axons
(A–D) Immunostaining for calretinin and AP in Brn3aCKOAP/+;Pax6αCre and Brn3aCKOAP/−;Pax6αCre retinas at P4 and P11. The inner retina is shown with the GCL at the bottom. Schematic at right is as for Figure 3. Scale bar in D: 40 μm. (E–H′) Coronal sections of Brn3bCKOAP/+;Pax6αCre and Brn3bCKOAP/−;Pax6αCre brains at the level of: (E,E′) the optic chiasm and (F,F′) 200 μm posterior to the chiasm at P9, and (G–H′) the MTN at E17 and P3. Scale bar in F:1 mm.
Figure 7
Figure 7. Deficits in visual behavioral in Brn3b−/− mice
(A,B) OKR measured by infrared imaging of eye position in response to temporal-to-nasal (horizontal OKR) or dorsal-to-ventral (vertical OKR) motion of black and white stripes during the 30 second period indicated by the striped pattern at the top of each panel in (A). In (B) the number of eye tracking movements (ETMs; each ETM is defined as a slow tracking movement followed by a rapid saccade) is plotted for WT and Brn3b−/− mice. The number of mice tested for each condition is indicated in panel B. [One Brn3b−/− mouse produced a small number of ETMs to vertical stimuli; subsequent testing showed that this was due to imperfect vertical alignment of the head. These data account for the non-zero value of the averaged Brn3b−/− vertical OKRs in panel B.] (C–E) Pupillary light responses. C, Brn3b−/− mice show little pupillary constriction to 200 lux, but a normal ciliary muscle response to 1% topical carbachol; dashed lines indicate the boundaries of the pupil. D, WT mice show rapid pupil constriction in response to illumination, with greater constriction in response to higher intensity illumination; Brn3b−/− mice show variable responses with, on average, little constriction even at the highest level of illumination (400 lux); each curve shows the average and standard deviation of three trials with each of five mice (for WT: three Brn3b+/+ and two Brn3b+/−). E, Extended time course of pupil responses of WT, TKO (triple knockout; Opn4−/−Gnat1−/−;Cnga3−/− mice in which rods, cones, and intrinsically photosensitive RGCs are inactivated37,38,39,44) and Brn3b−/− mice to switching from darkness to 400 lux and then back to darkness (top bar). (F–H) Actograms for a Brn3b+/− and two Brn3b−/− mice subjected to various light-dark regimens as described in the text. Numbers mark hours; each horizontal line in F and G corresponds to 48 hours. F, 12:12 LD cycles of intensities 1000 (i), 100 (ii), and 10 (iii) lux; after 12 days of constant darkness, mice were exposed to a 15 minute, 1500 lux light pulse (white dot) at CT16 (iv); and a jet-lag paradigm (v) in which the LD cycle was advanced and then delayed by six hours. G, constant light (1000 lux). H, ultradian 3.5:3.5 LD cycle.

Similar articles

Cited by

References

    1. Badea TC, Nathans J. Quantitative analysis of neuronal morphologies in the mouse retina visualized by using a genetically directed reporter. J Comp Neurol. 2004;480:331–351. - PubMed
    1. Badea TC, Wang Y, Nathans J. A noninvasive genetic/pharmacologic strategy for visualizing cell morphology and clonal relationships in the mouse. J Neurosci. 2003;23:2314–2322. - PMC - PubMed
    1. Bisti S, Gargini C, Chalupa LM. Blockade of glutamate-mediated activity in the developing retina perturbs the functional segregation of ON and OFF pathways. J Neurosci. 1998;18:5019–5025. - PMC - PubMed
    1. Bodnarenko SR, Chalupa LM. Stratification of ON and OFF ganglion cell dendrites depends on glutamate-mediated afferent activity in the developing retina. Nature. 1993;364:144–146. - PubMed
    1. Cahill H, Nathans J. The optokinetic reflex as a tool for quantitative analyses of nervous system function in mice: application to genetic and drug-induced variation. PLoS ONE. 2008;3:e2055. - PMC - PubMed

Publication types

MeSH terms

LinkOut - more resources