. 2009 Apr 22;28(8):1016-28.
doi: 10.1038/emboj.2009.47. Epub 2009 Feb 26.

Microtubule nucleation at the cis-side of the Golgi apparatus requires AKAP450 and GM130

Affiliations

Microtubule nucleation at the cis-side of the Golgi apparatus requires AKAP450 and GM130

Sabrina Rivero et al. EMBO J. .

Abstract

We report that microtubule (MT) nucleation at the Golgi apparatus requires AKAP450, a centrosomal gamma-TuRC-interacting protein that also forms a distinct network associated with the Golgi. Depletion of AKAP450 abolished MT nucleation at the Golgi, whereas depletion of the cis-Golgi protein GM130 led to the disorganisation of AKAP450 network and impairment of MT nucleation. Brefeldin-A treatment induced relocalisation of AKAP450 to ER exit sites and concomitant redistribution of MT nucleation capacity to the ER. AKAP450 specifically binds the cis-side of the Golgi in an MT-independent, GM130-dependent manner. Short AKAP450-dependent growing MTs are covered by CLASP2. Like for centrosome, dynein/dynactin complexes are necessary to anchor MTs growing from the Golgi. We further show that Golgi-associated AKAP450 has a role in cell migration rather than in cell polarisation of the centrosome-Golgi apparatus. We propose that the recruitment of AKAP450 on the Golgi membranes through GM130 allows centrosome-associated nucleating activity to extend to the Golgi, to control the assembly of subsets of MTs ensuring specific functions within the Golgi or for transporting specific cargos to the cell periphery.


Figures

Figure 1
Figure 1
AKAP450 is present into a network associated to the cis-face of the GA. (A) RPE1 cells stained with A24 antibody. (B) NP-40-soluble (SF) and insoluble (IF) fractions from RPE1 cells were analysed by WB with A24 antibody. (C) RPE1 cells were transfected with scramble or knockdown siRNAs (AKAP-1 or AKAP-2), short hairpin expressing pSUPER (AKAP-1 shRNA) or lentiviral (AKAP-1 shRNA lentivirus) vectors. After 72 h, a total lysate was prepared and analysed by WB for AKAP450 or α-tubulin as a loading control. Alternatively cells were fixed and processed by IF with A24 antibody. D, depleted cells; ND, nondepleted cells. Arrowheads indicate the centrosome (CTR). (DF) Double-labelled cells for AKAP450 (green) and GM130 (D), CTR433 (E) or Golgin245 (F) were analysed by confocal microscopy. Merged images are shown. Arrowheads point to the centrosome. Bars, 10 μm. Fluorescence intensity profiles (at bottom) correspond to lines drawn in images D, E and F (lines 1, 2 and 3 as indicated). (G) Quantification of colocalisation by ICA based on the Pearson's correlation coefficient. The values are means of 10 lines drawn at random positions in 16 different cells, each line contained 500 pixels in average. Errors bars indicate ±s.e.m.
Figure 2
Figure 2
AKAP450 association with membranes is preserved in the absence of MTs. (A) RPE1 cells were incubated at 4°C for 40 min and labelled for AKAP450 (green), tubulin (red) and Golgin245 (blue) or were treated with NZ for 2 h (B, C) and triple labelled for AKAP450 (green), GM130 (B, red) or CTR433 (C, red) and Golgin245 (blue). Boxes in B and C are enlarged on the right of each image. Fluorescence intensity profiles taken from the lines indicated in the respective enlarged boxes (1 and 2) are depicted at right. Note the nearly identical localisation of AKAP450 and GM130 in line 1. (D) Taxol-treated cells triple labelled for AKAP450 (green), tubulin (red) and GMAP210 (blue). (E) AKAP450 network is sensitive to BFA treatment. Merged image showing the association of AKAP450 (green) with ERES revealed with anti-GMAP210 (red) and anti-Sec31 antibodies (blue). Gray images of each single channel from the inset area are shown at right. Arrowheads point to the centrosome. Bars, 10 μm. (F) Co-immunoprecipitation of AKAP450, GCP2 and γ-tubulin from control or treated cells as indicated, using A24 antibody. Blots were also revealed for α-tubulin as a negative control. E, total extract; IP, immunoprecipitates.
Figure 3
Figure 3
MT nucleation at the GA. (A, B) MTs formed after cold-induced depolymerisation (A) and rewarming (B1, arrows), colocalised with AKAP450 (B2, arrows) and with the GA labelled for Golgin245 (B3, merged image). (C, D) NZ-treated cells at 0 (C) or 5 min (D) after washout were quadruple labelled as follows: monoclonal anti-giantin and anti-tubulin antibodies were revealed with the same secondary anti-mouse antibody, whereas AKAP450 and Golgin245 were revealed by anti-rabbit and anti-human antibodies, respectively. In D1, both giantin and tubulin labellings are shown. In C and D3, giantin and tubulin are in green, AKAP450 in red and Golgin245 in blue. B1, B2, D1and D2 are inverted images. (E) A high magnification view of cells processed like in D shows that growing MTs contain AKAP450 at their minus ends. (F) A Golgi mini-stack quadruple labelled like in D showing that MT outgrowth occurs from the cis-face where AKAP450 is located. Bars, 10 μm.
Figure 4
Figure 4
AKAP450 is required for MT nucleation at the GA. (AD) Control (A, C) or AKAP450-depleted (B, D) cold-treated cells after 1 min of rewarming (A, B) or NZ-treated cells after 5 min washout (C, D) were labelled for AKAP450 (red), tubulin (green) and GMAP210 (blue). A1–D1 are inverted images of tubulin staining. A2–D2 are merged images. In E, F, AKAP450 nondepleted (E) or AKAP450-depleted (F) cold-treated cells after 5 min at room temperature are shown labelled for AKAP450 in red, tubulin in green and GMAP210 in blue. E1 and F1 are inverted images of tubulin staining. Merged images are shown in E2 and F2. Arrows indicate the centrosome. Bars, 10 μm.
Figure 5
Figure 5
AKAP450-nucleated MTs are coated with CLASP2 at early stages of regrowth. (A, B) CLASP2 localisations before and after NZ washout. In NZ, both CLASP2 and AKAP450 associate with Golgi ministacks and with the centrosome (A). Three minutes after NZ removal, CLASP2 is detected at the newly formed MTs arising from AKAP450 containing elements (B, arrowheads). A1 and B1 are inverted images of tubulin staining; the same cells stained for AKAP450 (red) and CLAPS2 (green) are shown in A2 and B2. Boxes are enlarged at right. Bars, 10 μm.
Figure 6
Figure 6
In BFA-treated cells, AKAP450-dependent MT nucleation activity is redistributed to ERES. (AC) Double BFA-NZ-treated cells fixed at 0 (A), 5 (B) or 10 min (C) after NZ washout stained for AKAP450, tubulin and GMAP210. A1–C1 are inverted images of tubulin staining. A2–C2 are merged images with AKAP450 in red, tubulin in green and GMAP210 in blue. Arrowheads in B and C indicate MTs emanating from ERES. (DE) Similar experiments in AKAP450-depleted cells. Note that MTs only grow from the centrosome. Arrow indicates the centrosome (CTR). Bars, 10 μm.
Figure 7
Figure 7
Docking of AKAP450 network to cis-GA is mediated by GM130. (A, B) Depletion of GM130 (A1) disrupts AKAP450 network (A2) and slightly modified Golgi morphology as revealed by staining for GMAP210 (A3). On the contrary, GRASP65 knockdown (B1) did not affect neither AKAP450 network (B2) nor Golgi ribbon integrity (B3). Merged images are shown in A4 and B4. (C, D) Nocodazole treatment in control (C) and GM130-depleted (D) cells. Merged images are shown with AKAP450 in red, GMAP210 in green and GM130 in blue. (E, F) Control (E) or GM130-depleted cells (F) 5 min after NZ washout labelled for AKAP450 (red) and α-tubulin (green). In top panels (E1 and F1) inverted images of tubulin staining are shown. Arrowheads in (E) show MTs growing from distinct centres, whereas they indicate single MTs growing from dispersed AKAP450 aggregates in (F). The centrosome is indicated (CTR). Bottom panels (E2 and F2) are merged images with tubulin in green and AKAP450 in red. Bars, 10 μm. (G) The percentage of cells containing MT asters growing from Golgi elements in control and GM130-knockdown cells was determined (n=100 cells, two experiments). (H) RPE1 cell extracts were incubated with anti-GM130 antibody. Immunoprecipitates were analysed by WB for AKAP450, GM130 and α-tubulin as a negative control. Alternatively, immunoprecipitation experiments were carried out with A24 antibody on lysates from RPE1 cells transfected with a YFP-GM130 coding vector. Co-immunoprecipitating proteins were analysed by WB for AKAP450, YFP, α-tubulin as a negative control and GCP2 as a positive control. Antibody-free beads were used as controls (no AB IP).
Figure 8
Figure 8
Dynein/dynactin complex is involved in MTs anchoring at the GA. (A, B) Merged images of RPE1 cells transfected with the CC1 domain of p150glued and stained for AKAP450 (green), Golgin245 (blue) and CTR433 (red, A) or tubulin (red, B). Box from A is enlarged at right to show AKAP450 association with the centrosome (arrowhead) and with stacked Golgi elements (arrows). (C) MT repolymerisation experiments in p150glued CC1 transfected cells. Three minutes after rewarming, cells were fixed and stained for Golgin245 (C1), AKAP450 (C2) and tubulin (C3). A transfected (T) and a nontransfected cell (NT) are shown. In C4, a merged image is shown with AKAP450 in green, tubulin in red and Golgin245 in blue. Arrows indicate some AKAP450-containing Golgi elements in a transfected cell that do not nucleate MTs. Bars, 10 μm.
Figure 9
Figure 9
AKAP450-depletion decreased MT acetylation in the Golgi area. (A1A3) AKAP450 depleted (D) and nondepleted (ND) cells were fixed and labelled for AKAP450 (A1), acetylated tubulin (A2) and GMAP210 (A3, merged image). A1 and A2 are inverted images. (A4) A graphic representation of the percentage of AKAP450 depleted or nondepleted cells containing acetylated MTs in the Golgi area (n=200 cells, two experiments). (BG) Nondepleted (B–D) or depleted (E–G) RPE1 cells were cold treated for 40 min (B, E) and then rewarmed at RT for 10 min (C, F) or 20 min (D, G). After fixation, cells were labelled for acetylated tubulin (acetyl-TU) and AKAP450. In left panels of each figure, inverted images of acetylated MTs are shown. In right panels, merged images with acetylated MTs in green and AKAP450 labelling in red. Bars, 10 μm.
Figure 10
Figure 10
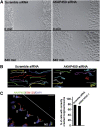
AKAP450-depleted cells are defective in cell migration. (A) Living RPE1 cells transfected with scramble siRNA or with AKAP450 siRNA were imaged at 30-min intervals for 14 h. The first (0 min, top) and last (840 min, bottom) frames of the movie are presented. For estimation of the surface covered by cells in the first and the last frames of control and AKAP450-depleted cells, the MethaMorph software was used. (B) For tracking, scramble siRNA and AKAP450 siRNA-transfected cells were recorded during 22 h. Migration tracks of 14 randomly picked cells are represented in different colours. Arrows indicate two cells exhibiting normal migration. (C) Eight hours after wounding, siRNA AKAP-1 transfected cells were fixed and stained with anti-AKAP450 (green), anti-GM130 (red) and DAPI (blue). D, depleted cells; ND, nondepleted cells. The white line indicates the scratch orientation. Wound-edge cells having their Golgi/centrosome area in the quadrant that is in the front of the nucleus and facing the wound (as represented) were considered as correctly reoriented. At right, percentage of control or knockdown cells with Golgi/centrosome correctly reoriented. In knockdown experiments, only depleted cells (D) were counted. Results shown are means of two independent experiments for a total of at least 200 cells being scored in each condition. Bars, 50 μm.

Comment in

Similar articles

Cited by

References

    1. Bartolini F, Gundersen GG (2006) Generation of noncentrosomal microtubule arrays. J Cell Sci 119: 4155–4163 - PubMed
    1. Brummelkamp TR, Bernards R, Agami R (2002) A system for stable expression of short interfering RNAs in mammalian cells. Science 296: 550–553 - PubMed
    1. Burakov A, Kovalenko O, Semenova I, Zhapparova O, Nadezhdina E, Rodionov V (2008) Cytoplasmic dynein is involved in the retention of microtubules at the centrosome in interphase cells. Traffic 9: 472–480 - PubMed
    1. Chabin-Brion K, Marceiller J, Perez F, Settegrana C, Drechou A, Durand G, Pous C (2001) The Golgi complex is a microtubule-organizing organelle. Mol Biol Cell 12: 2047–2060 - PMC - PubMed
    1. Dixit R, Levy JR, Tokito M, Ligon LA, Holzbaur EL (2008) Regulation of dynactin through the differential expression of p150glued isoforms. J Biol Chem 283: 33611–33619 - PMC - PubMed

Publication types

MeSH terms