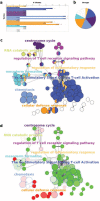
ClueGO: a Cytoscape plug-in to decipher functionally grouped gene ontology and pathway annotation networks
- PMID: 19237447
- PMCID: PMC2666812
- DOI: 10.1093/bioinformatics/btp101
ClueGO: a Cytoscape plug-in to decipher functionally grouped gene ontology and pathway annotation networks
Abstract
We have developed ClueGO, an easy to use Cytoscape plug-in that strongly improves biological interpretation of large lists of genes. ClueGO integrates Gene Ontology (GO) terms as well as KEGG/BioCarta pathways and creates a functionally organized GO/pathway term network. It can analyze one or compare two lists of genes and comprehensively visualizes functionally grouped terms. A one-click update option allows ClueGO to automatically download the most recent GO/KEGG release at any time. ClueGO provides an intuitive representation of the analysis results and can be optionally used in conjunction with the GOlorize plug-in.
Figures

Similar articles
-
Comprehensive functional analysis of large lists of genes and proteins.J Proteomics. 2018 Jan 16;171:2-10. doi: 10.1016/j.jprot.2017.03.016. Epub 2017 Mar 22. J Proteomics. 2018. PMID: 28343001
-
Automated exploration of gene ontology term and pathway networks with ClueGO-REST.Bioinformatics. 2019 Oct 1;35(19):3864-3866. doi: 10.1093/bioinformatics/btz163. Bioinformatics. 2019. PMID: 30847467 Free PMC article.
-
Gene Ontology analysis in multiple gene clusters under multiple hypothesis testing framework.Artif Intell Med. 2007 Oct;41(2):105-15. doi: 10.1016/j.artmed.2007.08.002. Artif Intell Med. 2007. PMID: 17913480
-
Ontology annotation: mapping genomic regions to biological function.Curr Opin Chem Biol. 2007 Feb;11(1):4-11. doi: 10.1016/j.cbpa.2006.11.039. Epub 2007 Jan 5. Curr Opin Chem Biol. 2007. PMID: 17208035 Review.
-
A survey of current software for network analysis in molecular biology.Hum Genomics. 2010 Jun;4(5):353-60. doi: 10.1186/1479-7364-4-5-353. Hum Genomics. 2010. PMID: 20650822 Free PMC article. Review.
Cited by
-
A Potential Autophagy-Related Competing Endogenous RNA Network and Corresponding Diagnostic Efficacy in Schizophrenia.Front Psychiatry. 2021 Feb 23;12:628361. doi: 10.3389/fpsyt.2021.628361. eCollection 2021. Front Psychiatry. 2021. PMID: 33708146 Free PMC article.
-
Network analysis of gene expression in peripheral blood identifies mTOR and NF-κB pathways involved in antipsychotic-induced extrapyramidal symptoms.Pharmacogenomics J. 2015 Oct;15(5):452-60. doi: 10.1038/tpj.2014.84. Epub 2015 Jan 27. Pharmacogenomics J. 2015. PMID: 25623440
-
Eucommia ulmoides Oliver's Multitarget Mechanism for Treatment of Ankylosing Spondylitis: A Study Based on Network Pharmacology and Molecular Docking.Evid Based Complement Alternat Med. 2022 Oct 11;2022:3699146. doi: 10.1155/2022/3699146. eCollection 2022. Evid Based Complement Alternat Med. 2022. PMID: 36267087 Free PMC article.
-
Blood RNA signature RISK4LEP predicts leprosy years before clinical onset.EBioMedicine. 2021 Jun;68:103379. doi: 10.1016/j.ebiom.2021.103379. Epub 2021 Jun 3. EBioMedicine. 2021. PMID: 34090257 Free PMC article.
-
CeRNA Network Analysis Representing Characteristics of Different Tumor Environments Based on 1p/19q Codeletion in Oligodendrogliomas.Cancers (Basel). 2020 Sep 7;12(9):2543. doi: 10.3390/cancers12092543. Cancers (Basel). 2020. PMID: 32906679 Free PMC article.
References
-
- Garcia O, et al. GOlorize: a cytoscape plug-in for network visualization with Gene Ontology-based layout and coloring. Bioinformatics. 2007;23:394–396. - PubMed
Publication types
MeSH terms
LinkOut - more resources
Full Text Sources
Other Literature Sources

