Activation of mammalian target of rapamycin controls the loss of TCRzeta in lupus T cells through HRES-1/Rab4-regulated lysosomal degradation
- PMID: 19201859
- PMCID: PMC2676112
- DOI: 10.4049/jimmunol.0803600
Activation of mammalian target of rapamycin controls the loss of TCRzeta in lupus T cells through HRES-1/Rab4-regulated lysosomal degradation
Abstract
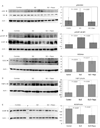
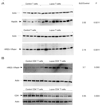
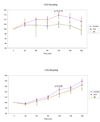
Persistent mitochondrial hyperpolarization (MHP) and enhanced calcium fluxing underlie aberrant T cell activation and death pathway selection in systemic lupus erythematosus. Treatment with rapamycin, which effectively controls disease activity, normalizes CD3/CD28-induced calcium fluxing but fails to influence MHP, suggesting that altered calcium fluxing is downstream or independent of mitochondrial dysfunction. In this article, we show that activity of the mammalian target of rapamycin (mTOR), which is a sensor of the mitochondrial transmembrane potential, is increased in lupus T cells. Activation of mTOR was inducible by NO, a key trigger of MHP, which in turn enhanced the expression of HRES-1/Rab4, a small GTPase that regulates recycling of surface receptors through early endosomes. Expression of HRES-1/Rab4 was increased in CD4(+) lupus T cells, and in accordance with its dominant impact on the endocytic recycling of CD4, it was inversely correlated with diminished CD4 expression. HRES-1/Rab4 overexpression was also inversely correlated with diminished TCRzeta protein levels. Pull-down studies revealed a direct interaction of HRES-1/Rab4 with CD4 and TCRzeta. Importantly, the deficiency of the TCRzeta chain and of Lck and the compensatory up-regulation of FcepsilonRIgamma and Syk, which mediate enhanced calcium fluxing in lupus T cells, were reversed in patients treated with rapamcyin in vivo. Knockdown of HRES-1/Rab4 by small interfering RNA and inhibitors of lysosomal function augmented TCRzeta protein levels in vitro. The results suggest that activation of mTOR causes the loss of TCRzeta in lupus T cells through HRES-1/Rab4-dependent lysosomal degradation.
Figures


Similar articles
-
T-cell and B-cell signaling biomarkers and treatment targets in lupus.Curr Opin Rheumatol. 2009 Sep;21(5):454-64. doi: 10.1097/BOR.0b013e32832e977c. Curr Opin Rheumatol. 2009. PMID: 19550330 Free PMC article. Review.
-
Lupus-associated endogenous retroviral LTR polymorphism and epigenetic imprinting promote HRES-1/RAB4 expression and mTOR activation.JCI Insight. 2020 Jan 16;5(1):e134010. doi: 10.1172/jci.insight.134010. JCI Insight. 2020. PMID: 31805010 Free PMC article.
-
Regulation of CD4 expression via recycling by HRES-1/RAB4 controls susceptibility to HIV infection.J Biol Chem. 2006 Nov 10;281(45):34574-91. doi: 10.1074/jbc.M606301200. Epub 2006 Aug 24. J Biol Chem. 2006. PMID: 16935861
-
HRES-1/Rab4-mediated depletion of Drp1 impairs mitochondrial homeostasis and represents a target for treatment in SLE.Ann Rheum Dis. 2014 Oct;73(10):1888-97. doi: 10.1136/annrheumdis-2013-203794. Epub 2013 Jul 29. Ann Rheum Dis. 2014. PMID: 23897774 Free PMC article.
-
Molecular mimicry and immunomodulation by the HRES-1 endogenous retrovirus in SLE.Autoimmunity. 2008 May;41(4):287-97. doi: 10.1080/08916930802024764. Autoimmunity. 2008. PMID: 18432409 Free PMC article. Review.
Cited by
-
Add-on sirolimus for the treatment of mild or moderate systemic lupus erythematosus via T lymphocyte subsets balance.Lupus Sci Med. 2024 Feb 13;11(1):e001072. doi: 10.1136/lupus-2023-001072. Lupus Sci Med. 2024. PMID: 38351097 Free PMC article.
-
Cell type-specific mechanistic target of rapamycin-dependent distortion of autophagy pathways in lupus nephritis.Transl Res. 2022 Jul;245:55-81. doi: 10.1016/j.trsl.2022.03.004. Epub 2022 Mar 12. Transl Res. 2022. PMID: 35288362 Free PMC article. Review.
-
Central role of nitric oxide in the pathogenesis of rheumatoid arthritis and systemic lupus erythematosus.Arthritis Res Ther. 2010;12(3):210. doi: 10.1186/ar3045. Epub 2010 Jun 28. Arthritis Res Ther. 2010. PMID: 20609263 Free PMC article. Review.
-
Metabolic Fitness of T Cells in Autoimmune Disease.Immunometabolism. 2020;2(2):e200017. doi: 10.20900/immunometab20200017. Epub 2020 Apr 22. Immunometabolism. 2020. PMID: 32477606 Free PMC article.
-
At the Bedside: Neutrophil extracellular traps (NETs) as targets for biomarkers and therapies in autoimmune diseases.J Leukoc Biol. 2016 Feb;99(2):265-78. doi: 10.1189/jlb.5BT0615-234R. Epub 2015 Dec 11. J Leukoc Biol. 2016. PMID: 26658004 Free PMC article. Review.
References
-
- Emlen W, Niebur JA, Kadera R. Accelerated in vitro apoptosis of lymphocytes from patients with systemic lupus erythematosus. J.Immunol. 1994;152:3685–3692. - PubMed
-
- Kovacs B, Vassilopoulos D, Vogelgesang SA, Tsokos GC. Defective CD3-mediated cell death in activated T cells from patients with systemic lupus erythematosus: role of decreased intracellular TNF-alpha. Clin.Immunol.Immunopathol. 1996;81:293–302. - PubMed
Publication types
MeSH terms
Substances
Grants and funding
- R01 AI048079-02/AI/NIAID NIH HHS/United States
- R56 AI048079-06/AI/NIAID NIH HHS/United States
- AI-072648/AI/NIAID NIH HHS/United States
- R01 AI048079-05/AI/NIAID NIH HHS/United States
- R01 AI-048079/AI/NIAID NIH HHS/United States
- R56 AI048079/AI/NIAID NIH HHS/United States
- R01 AI048079-04/AI/NIAID NIH HHS/United States
- R01 AI072648-01A2/AI/NIAID NIH HHS/United States
- R01 AI048079-03/AI/NIAID NIH HHS/United States
- R01 AI048079-01/AI/NIAID NIH HHS/United States
- R21 AI061066-01/AI/NIAID NIH HHS/United States
- R01 AI048079/AI/NIAID NIH HHS/United States
- R21 AI061066/AI/NIAID NIH HHS/United States
- R01 AI072648/AI/NIAID NIH HHS/United States
LinkOut - more resources
Full Text Sources
Other Literature Sources
Medical
Molecular Biology Databases
Research Materials
Miscellaneous

