Review
. 2009 Apr;37(6):1713-25.
doi: 10.1093/nar/gkp026. Epub 2009 Feb 3.

Circular dichroism and conformational polymorphism of DNA

Affiliations
Review

Circular dichroism and conformational polymorphism of DNA

Jaroslav Kypr et al. Nucleic Acids Res. 2009 Apr.

Abstract

Here we review studies that provided important information about conformational properties of DNA using circular dichroic (CD) spectroscopy. The conformational properties include the B-family of structures, A-form, Z-form, guanine quadruplexes, cytosine quadruplexes, triplexes and other less characterized structures. CD spectroscopy is extremely sensitive and relatively inexpensive. This fast and simple method can be used at low- as well as high-DNA concentrations and with short- as well as long-DNA molecules. The samples can easily be titrated with various agents to cause conformational isomerizations of DNA. The course of detected CD spectral changes makes possible to distinguish between gradual changes within a single DNA conformation and cooperative isomerizations between discrete structural states. It enables measuring kinetics of the appearance of particular conformers and determination of their thermodynamic parameters. In careful hands, CD spectroscopy is a valuable tool for mapping conformational properties of particular DNA molecules. Due to its numerous advantages, CD spectroscopy significantly participated in all basic conformational findings on DNA.


Figures
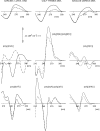
Figure 1.
Figure 1.
Sequence-dependent CD spectra. Upper row: native DNAs from Sarcina lutea (71% G + C), calf thymus (42% G + C) and Bacillus cereus (33% G + C). Middle and bottom rows: synthetic polynucleotides. The spectra were measured in 10 mM sodium acetate, pH 7 (solid lines), 5 M NaCl (dashed lines) and 3.5 M NaCl (dash-dotted line). The spectrum of poly[d(GC)] in 3.5 M NaCl corresponds to Z-form. Salt was increased by directly adding a high concentration stock solution to cells containing DNA; the salt and DNA concentrations were corrected for the volume increase. Spectra of the natural DNAs were measured on a Roussel–Jouan dichrograph, Model CD 185. Spectra of the polynucleotides in this and in the following figures were measured on Jobin–Yvon dichrographs, Mark IV or Mark VI and, unless stated otherwise, in 1 cm cells (absorption ∼0.7) and at room temperature. CD in all figures is expressed as Δε (M−1cm−1) with molarity based on nucleoside residues in the DNA samples. The pH values were determined using a Sentron Red-Line electrode and a Sentron Titan pH meter.
Figure 2.
Figure 2.
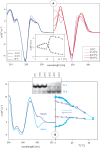
Temperature induced changes in CD spectra reflecting pre-melting and melting of DNA. (A) Spectra of poly[d(AT)] in 10 mM Na acetate, pH 7 at temperatures indicated. The left panel reflects changes within double-helical structure and the right panel shows a helix–coil transition. Insert: the changes in poly[d(AT)] monitored at 262 nm (triangles) and 220 nm (squares). (B) Irreversible duplex–hairpin transition of d(C6G6) in 1 mM Na phosphate, 0.3 mM EDTA, pH 7. Left: CD spectra measured at 0°C corresponding to duplex (cyan) before denaturation and hairpin (dark blue) after denaturation. Right: spectral changes induced by increasing (cyan) and decreasing (dark blue) temperatures monitored at 260 (squares) and 280 (triangles) nm. CD spectra were measured in 0.1 cm cells. Insert: polyacrylamide gel (20%) electrophoresis of the samples running in the same buffer at 2°C. The samples were exposed to the indicated temperatures prior to loading on the gel.
Figure 3.
Figure 3.
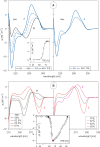
B–A and B–Z transitions of DNA. (A) Left panel: CD spectra reflecting trifluorethanol-induced B–A transition of d(GCGGCGACTGGTGAGTACGC) duplex. Insert: the transition monitored at 266 nm. Right panel: CD spectra of RNA of the same sequence (U instead of T) duplexed with complementary DNA strand. (B) CD spectra reflecting trifluorethanol-induced B–Z (left panel) and Z–Z′ (right panel) transitions of poly[d(GC)] duplex. Insert: the transitions monitored at 291 nm. In this figure, TFE was added to the oligonucleotides dissolved in 1 mM Na phosphate, 0.3 mM EDTA, pH 7 and CD spectra were measured at 0°C.
Figure 4.
Figure 4.
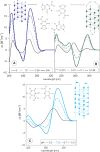
CD spectra of quadruplexes. Upper panels: CD spectra of guanine quadruplexes. (A) Time-dependent formation of a parallel-stranded quadruplex of d(G4) stabilized by 16 mM K+. (B) Na+-induced formation of an anti-parallel bimolecular quadruplex of d(G4T4G4). Both oligonucleotides were dissolved in 1 mM Na phosphate, 0.3 mM EDTA, pH 7 and thermally denatured (5 min at 90°C) and slowly cooled before starting measurements. The triangles in the sketches indicate guanines and point in the 5′–3′ direction. The G-tetrad is shown in the middle. Bottom panel: CD spectra reflecting the acid-induced transition of a DNA fragment d(TCCCCACCTTCCCCACCCTCCCCACCCTCCCCA) of a c-myc human oncogene into an intercalated cytosine quadruplex. The oligonucleotide was dissolved in Robinson–Britton buffer, pH 9.2 [24 mM (H3PO4 + H3BO3 + CH3COOH) + 82 mM NaOH]. The pH value was changed directly in the CD cell by addition of dilute HCl. The triangles in the sketch indicate cytosines and point in the 5′–3′ direction. The C+·C pair is shown in the insert.
Figure 5.
Figure 5.
CD spectra of d(GA)20. (A) Spectra reflecting formation of the zinc-specific anti-parallel homoduplex. The spectra were measured in Tris–HCl buffer, pH 8.3. The yellow line corresponds to 0.7 mM ZnCl2. (B) CD spectra reflecting the NaCl-induced transition of d(GA)10 into the parallel homoduplex. To increase the salt concentration, 5 M NaCl was added to the oligonucleotide dissolved in 10 mM sodium phosphate, pH 7. (C) CD spectra of an ordered single-stranded conformer containing protonated adenine. The pH value was changed directly in the CD cell by addition of dilute HCl to the oligonucleotide in 1 mM sodium phosphate.
Figure 6.
Figure 6.
B–A, B–X and A–X transitions of poly[d(AT)]. From the left to the right: CD spectrum of the B-form measured in 1 mM sodium phosphate, 0.25 mM EDTA, pH 7 (black); ethanol-induced B–A transition measured at 10°C and monitored by Δε at 262 nm (96% ethanol was added to the poly[d(AT)] sample). CD spectrum of the A-form in the presence of 0.2 mM sodium phosphate and 0.05 mM EDTA and 80% ethanol (blue); ethanol induced B–X transition measured in the presence of 1.3 mM CsCl at 4°C and monitored by Δε at 278 nm (1.3 mM CsCl was also present in ethanol). CD spectrum of the X-form in 0.15 mM sodium phosphate, 0.04 mM EDTA, 1.3 mM CsCl and 82% ethanol (violet). CD spectra reflecting the A–X transition induced by addition of CsCl (0, 0.53, 0.59 and 1.3 mM) to the A-form at 4°C and the course of the transition monitored by Δε at 278 nm. This figure was adapted from Vorlickova M. et al. (J. Biomol. Struct. Dyn. 1991, 9, 571–578) with permission.
Figure 7.
Figure 7.
MgCl2-induced B–Z and B–X transitions of poly[d(Gmethyl5C)] and poly[d(amino2AT)], respectively. Both polynucleotides were dissolved in 0.6 mM potassium phosphate buffer and 0.03 mM EDTA, pH 6.8. Left panel: the B–Z transition of poly[d(Gmethyl5C)] in 0.03 mM MgCl2 (thin line); spectra measured 1, 4, 17 and 88 min after increasing MgCl2 concentration to 0.05 mM (from dashed to full red line). Right panel: the B–X transition of poly[d(amino2AT)] in 0, 0.028, 0.056, 0.070 and 0.190 mM MgCl2 (from thin to the full violet line). Insert: the transitions of poly[d(Gmethyl5C)] (circles, Δε295) and poly[d(amino2AT)] (squares, Δε280). The left panel shows the MgCl2-induced B–Z and B–X transitions; on the right is the NaCl-induced reversion of the transitions and re-entry of the Z- and X-forms at high NaCl concentrations. It was necessary to wait hours to attain an equilibrium in the case of poly[d(Gmethyl5C)], whereas the equilibrium spectra of poly[d(amino2AT)] could be measured immediately after changing the solvent conditions. The sketch in the middle bottom indicates the difference in chemical structures of the two base pairs.
Figure 8.
Figure 8.
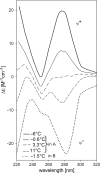
CD spectra reflecting the temperature-controlled psi-type condensation of poly[d(AT)] in ethanol-NaClO4 solutions. Solution A was 34% ethanol, 0.6 M NaClO4; solution B was 30% ethanol, 2.0 M NaClO4.
Figure 9.
Figure 9.
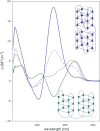
CD spectra and sketches of distinct quadruplex arrangements of a human telomere fragment G3(TTAG3)7. In green is the spectrum in 150 mM NaCl and the oligonucleotide adopts the antiparallel basket type quadruplex (92); in grey is the spectrum in 150 mM KCl; in blue dashes is the spectrum in 10 mM KCl, 57% ethanol measured 24 h after ethanol addition; and in blue is the spectrum of the same sample measured after denaturation and slow cooling to room temperature. The final spectrum corresponds to parallel quadruplex observed in the crystal (93).

Similar articles

Cited by

References

    1. Neidle S. Nucleic Acid Structure. New York: Oxford University Press Inc.; 1999.
    1. Mirkin SM. Discovery of alternative DNA structures: a heroic decade (1979-1989) Front. Biosci. 2008;13:1064–1071. - PubMed
    1. Wells RD. Non-B DNA conformations, mutagenesis and disease. Trends Biochem. Sci. 2007;32:271–278. - PubMed
    1. Nakanishi K, Berova N, Woody RW. Circular Dichroism Principles and Applications. New York: VCH Publishers Inc.; 1991.
    1. Woody RW. Circular dichroism. Methods Enzymol. 1995;246:34–71. - PubMed

Publication types