Comparative Study
. 2009 Feb 16;206(2):435-48.
doi: 10.1084/jem.20081829. Epub 2009 Feb 2.

The antigen-specific CD8+ T cell repertoire in unimmunized mice includes memory phenotype cells bearing markers of homeostatic expansion

Affiliations
Comparative Study

The antigen-specific CD8+ T cell repertoire in unimmunized mice includes memory phenotype cells bearing markers of homeostatic expansion

Catherine Haluszczak et al. J Exp Med. .

Abstract

Memory T cells exhibit superior responses to pathogens and tumors compared with their naive counterparts. Memory is typically generated via an immune response to a foreign antigen, but functional memory T cells can also be produced from naive cells by homeostatic mechanisms. Using a recently developed method, we studied CD8 T cells, which are specific for model (ovalbumin) and viral (HSV, vaccinia) antigens, in unimmunized mice and found a subpopulation bearing markers of memory cells. Based on their phenotypic markers and by their presence in germ-free mice, these preexisting memory-like CD44(hi) CD8 T cells are likely to arise via physiological homeostatic proliferation rather than a response to environmental microbes. These antigen-inexperienced memory phenotype CD8 T cells display several functions that distinguish them from their CD44(lo) counterparts, including a rapid initiation of proliferation after T cell stimulation and rapid IFN-gamma production after exposure to proinflammatory cytokines. Collectively, these data indicate that the unprimed antigen-specific CD8 T cell repertoire contains antigen-inexperienced cells that display phenotypic and functional traits of memory cells.

Keywords: Virtual Memory.


Figures
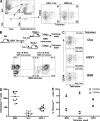
Figure 1.
Figure 1.
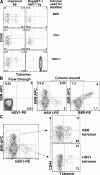
Quantitation and characterization of antigen-specific CD8+ T cells from unprimed mice. (A) Gating scheme for FACS analysis of peptide/MHC tetramer binding cells isolated by magnetic bead sorting. Left dot plots show a representative gating strategy used to identify CD8+ T cells isolated by magnetic bead column after tetramer staining. After this gating strategy, the cells were then analyzed as displayed in the right dot plots and show the general phenotype of the tetramer and CD44 staining profile. Numbers in top and bottom right quadrants indicate the percentage of tetramer+ cells that are either CD44hi or CD44lo, respectively. (B) As shown in the flow diagram, B6 spleen cells stained with the B8R tetramer were subjected to magnetic bead separation. The flow through and bound fraction were then injected into separate RAG−/− hosts, which were subsequently immunized with the B8R peptide plus poly-I:C and anti-CD40. 7 d after immunization, peripheral blood (depicted) and spleen (not depicted) were analyzed by B8R tetramer staining. The results shown are representative of six mice from three independent experiments. (C) Splenocytes from unprimed B6 mice were isolated using MHC tetramers loaded with the indicated peptides. Numbers outside the parentheses indicate the total number of cells in the mouse with the phenotype in that quadrant. Numbers inside the parentheses indicate the percentage of cells, out of all tetramer+ cells, that are either CD44hi or CD44lo. (D) Scatter plot shows the distribution of total tetramer+ cell numbers per spleen as isolated by the indicated MHC tetramer, one mouse spleen per data point. Horizontal lines show the mean value of the dots displayed. (E) The frequency of CD44lo and CD44hi cells within tetramer binding CD8 T cells from unprimed mice is shown for the indicated tetramers. The results shown are representative of at least 10 independent experiments, with the staining results pooled from four independent experiments showing 11 mice for the B8R tetramer, 9 mice for the OVA tetramer, and 6 mice for the HSV-1 tetramer. Error bars show SD.
Figure 2.
Figure 2.
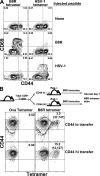
Specific tetramer staining of endogenous CD44hi CD8 T cells. (A) Tetramer staining and magnetic bead sorting was performed on spleen cells from B6 and RAG−/− gBT-1 mice using the indicated tetramers. Numbers in the plots indicate percentage of cells in that quadrant after having been gated as shown in Fig. 1 A. The results shown are representative of at least three independent experiments using a total of six mice from each strain. (B) Splenocytes from unprimed B6 mice were isolated using both PE- and APC-labeled MHC tetramers loaded with the indicated peptides, as described in the Materials and methods. Dot plots show all B220CD3+CD8+ events from either the flow through or column-bound fractions as indicated. Numbers in each quadrant indicate the percentage of total CD8+ cells in that quadrant. (C) Cells analyzed in B were further gated as indicated in the left dot plot and analyzed as shown in the right dot plots. Numbers in the top and bottom quadrants indicate the percentage of all tetramer+ events that are either CD44hi or CD44lo, respectively. The results for B and C are representative of 15 mice from at least five independent experiments.
Figure 3.
Figure 3.
Foreign antigen-reactive CD44hi CD8 T cells found in unprimed SPF mice. (A) B6 mice were injected i.v. with 400 mg of either B8R or HSV-1 peptide. 2 h later, the mice were killed, half of the spleen cells from each peptide-injected mouse were stained with the B8R/Kb tetramer, and the other half were stained with the HSVgB/Kb tetramer. B8R- and HSV-specific T cells from either peptide-challenged mice and from control mice were then isolated by magnetic column and analyzed for CD44 and CD69 expression on all tetramer-staining cells. Numbers in the top quadrants represent the percentage of CD69+ cells of all B220CD8+CD3+tetramer+ cells shown. The results shown are representative of six mice for each treatment group from three independent experiments. (B) As shown in the schematic, CD8+ T cells from unimmunized B6 mice were sorted based on their expression of CD44. CD44hi and CD44lo cells were transferred into separate RAG−/− mice, which were subsequently immunized with the B8R peptide in conjunction with poly-I:C and anti-CD40. 7 d after immunization, the spleen cells from each transferred and immunized host were stained with the indicated tetramers. The Kb/OVA tetramer was used as a staining control as shown. Numbers above each gate represent the percentage of tetramer-staining T cells out of total CD8+ T cells. The numbers in parentheses indicate the total number of tetramer-staining cells per mouse after immunization. The results shown are representative of eight total recipient mice from two independent experiments.
Figure 4.
Figure 4.
Foreign antigen-specific CD44hi CD8 T cells are found in GF mice. Spleen and LNs were collected from B6 mice maintained in GF versus SPF conditions and subjected to tetramer enrichment using B8R/Kb and OVA/Kb tetramers. (A) Dot plots show representative tetramer staining of the column-bound pool gated on CD3+CD8+ B220/CD4 cells. (B) The total numbers of tetramer-bound CD8 T cells detected in unprimed SPF and GF mice compiled from three independent experiments (n = 9 for both SPF and GF mice). The graph shows mean and SD. (C) Representative data showing phenotype of column-bound cells. The data are gated on dump CD3+CD8+ T cells and show CD44 versus tetramer staining for cells from SPF and GF animals. Percentages are of tetramer-bound cells. (D) Mean percentage of CD44hi and CD44lo phenotype cells detected in unprimed SPF and GF mice within the indicated tetramer+ population. Numbers reflect mean and SD, with the data compiled from nine mice in each group.
Figure 5.
Figure 5.
Phenotypic analysis of CD44hi and CD44lo tetramer-bound T cells from unprimed mice. (A) B8R-specific T cells were isolated by tetramer staining and magnetic bead separation from the spleens of both unprimed and day-4 vaccinia virus–challenged mice. The cells were stained with CD44 and the indicated activation markers. The data shown is gated as in Fig. 1 A and shows all B220/CD8+/CD3+/tetramer+ events. Numbers in each quadrant indicate the percentage of B8R tetramer+ cells within that quadrant. The results shown are representative of eight mice from four independent experiments. (B) Naive OT-I CD8 T cells were transferred into either irradiated B6 mice (to generate HP memory cells) or LM-OVA–infected mice (to generate “true” memory cells). At least 30 d later, the donor OT-I cells (identified using OVA/Kb tetramer) were assessed for their expression on α4-integrin. For comparison, α4-integrin on bulk endogenous CD8 T cells is shown, as is isotype control staining. These data are representative of at least three experiments with two to three mice per group. (C) B8R-specific CD8+ T cells isolated by magnetic bead separation, as in A, from an unprimed B6 (top contour plots) were compared with the CD8+ spleen cells from a gBT-1RAG−/− mouse (bottom contour plots) with respect to the activation markers shown. Cells were gated on all CD8+/B220/CD3+/tetramer+ events.
Figure 6.
Figure 6.
During primary stimulation, antigen-specific CD44hi CD8 T cells respond more quickly than CD44lo CD8 T cells. (A) Unprimed B6 mice, or mice challenged with vaccinia virus 30 d earlier, were injected i.v. with 300 µg B8R peptide and BFA 2 h before spleen harvest as described in the Materials and methods. The B8R-specific T cells were isolated by tetramer staining and magnetic bead sorting as described in Fig. 1, except that BFA was included in all buffers. The cells were stained for surface markers and intracellular IFN-γ as previously described (52). (B) B6 mice were immunized with 100 mg B8R peptide and 50 mg of anti-CD40 antibody at the indicated times before the harvest of their spleen cells. As in A, the mice were injected with B8R peptide and BFA 2 h before being killed, and their B8R-specific T cells were isolated by tetramer staining and magnetic bead sorting. The cells were stained for surface markers and intracellular IFN-γ as previously described (52). The contour plots shown were gated on all CD8+B220 tetramer+ T cells. (C) B6 splenocytes were harvested from unprimed animals and tetramer enrichment was performed (using both B8R/Kb and HSV-1/Kb tetramers). Tetramer+ and tetramer CD8 T cells were both sorted into CD44hi and CD44lo populations, each was CFSE-labeled, and the cells were stimulated in vitro on antigen (B8R and HSV peptide)-pulsed splenocytes. 2 or 3 d later (as indicated), the proliferation of the tetramer+ (solid lines) and tetramer (dashed lines) pools were assessed by CFSE dye dilution. (D) Compiled data from three experiments performed as in C, showing the frequency of CFSE-diluted responder cells on day 3 after stimulation. Error bars show SD.
Figure 7.
Figure 7.
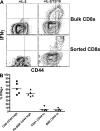
Antigen-specific CD44hi CD8 T cells make IFN-γ in response to innate cytokine stimulation. Spleen cells from B6 mice were cultured for 18 h in the presence of either IL-2 or a mixture of IL-2, IL-12, and IL-18. BFA was added for the last 4 h of culture. Cells were then subjected to tetramer enrichment using B8R/Kb tetramers. (A) Representative staining of either bulk CD8 T cells (top) or B8R/Kb tetramer binding CD8 T cells (bottom) for IFN-γ. (B) The percentage of IFN-γ+ cells in the CD44hi and CD44lo compartments of bulk CD8 T cells or B8R/Kb-specific CD8 T cells. Each symbol represents an independent sample (n = 5), and the data are compiled from three experiments. Horizontal lines show the mean values of each group.

Similar articles

Cited by

References

    1. Harty J.T., Badovinac V.P. 2008. Shaping and reshaping CD8+ T-cell memory.Nat. Rev. Immunol. 8:107–119 - PubMed
    1. Seder R.A., Ahmed R. 2003. Similarities and differences in CD4+ and CD8+ effector and memory T cell generation.Nat. Immunol. 4:835–842 - PubMed
    1. Jameson S.C. 2005. T cell homeostasis: keeping useful T cells alive and live T cells useful.Semin. Immunol. 17:231–237 - PubMed
    1. Marleau A.M., Sarvetnick N. 2005. T cell homeostasis in tolerance and immunity.J. Leukoc. Biol. 78:575–584 - PubMed
    1. Surh C.D., Sprent J. 2005. Regulation of mature T cell homeostasis.Semin. Immunol. 17:183–191 - PubMed

Publication types