. 2009 Feb 20;30(2):264-76.
doi: 10.1016/j.immuni.2008.12.014. Epub 2009 Jan 29.

Conduits mediate transport of low-molecular-weight antigen to lymph node follicles

Affiliations

Conduits mediate transport of low-molecular-weight antigen to lymph node follicles

Ramon Roozendaal et al. Immunity. .

Abstract

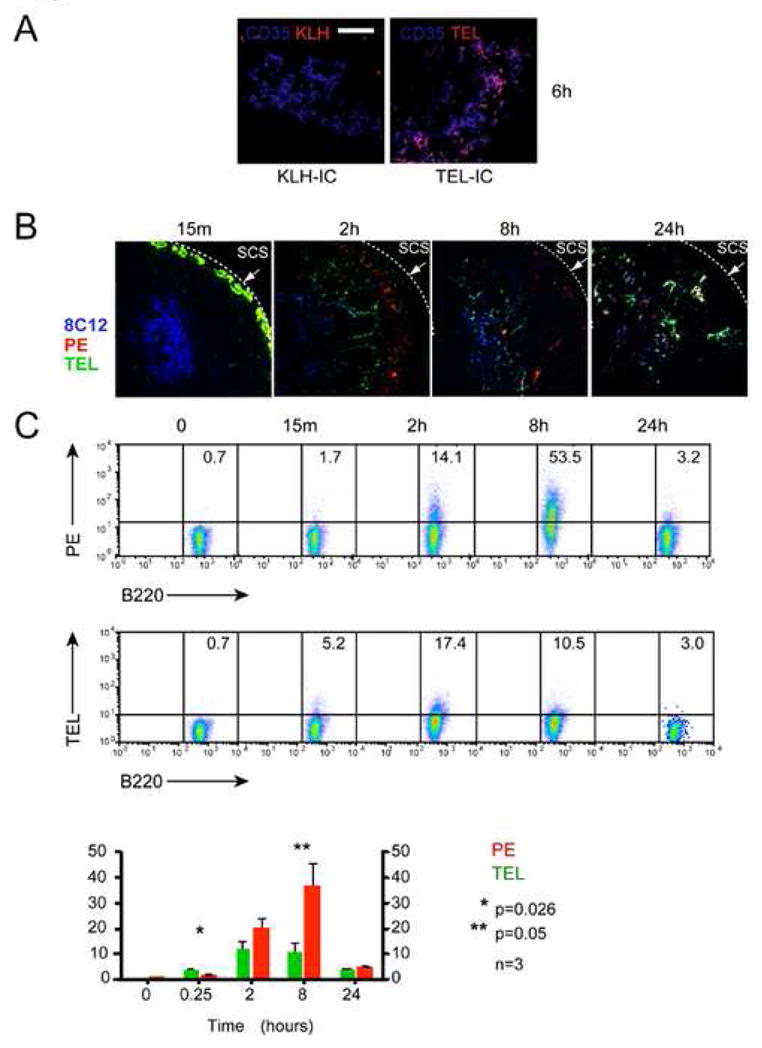
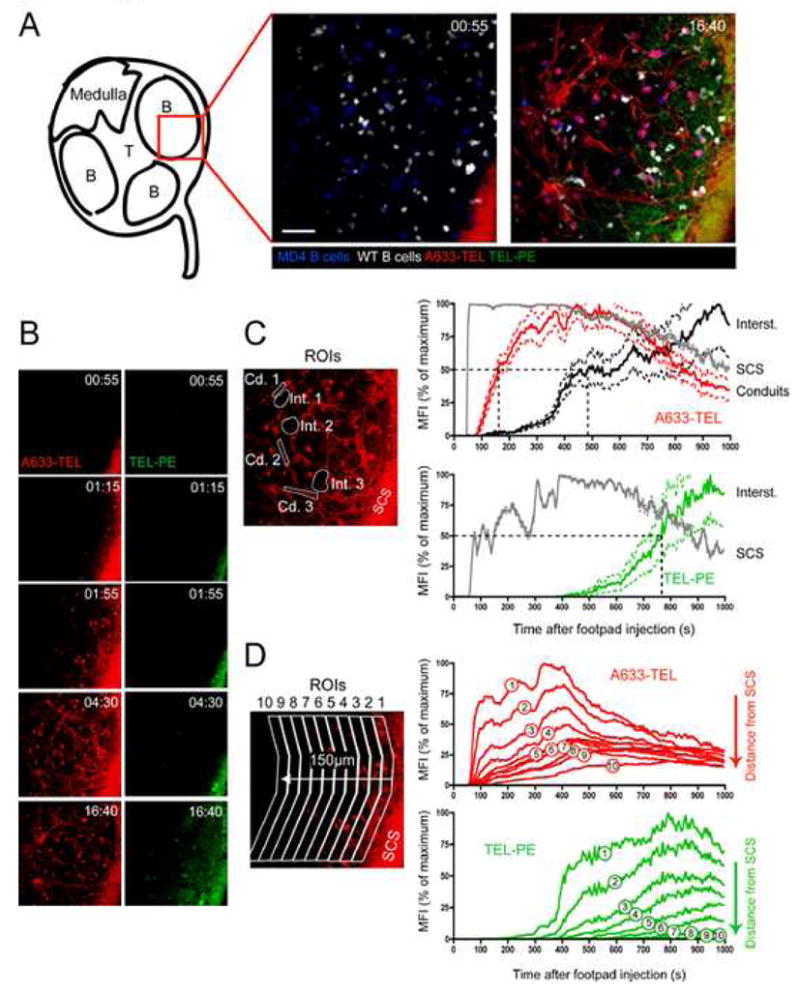
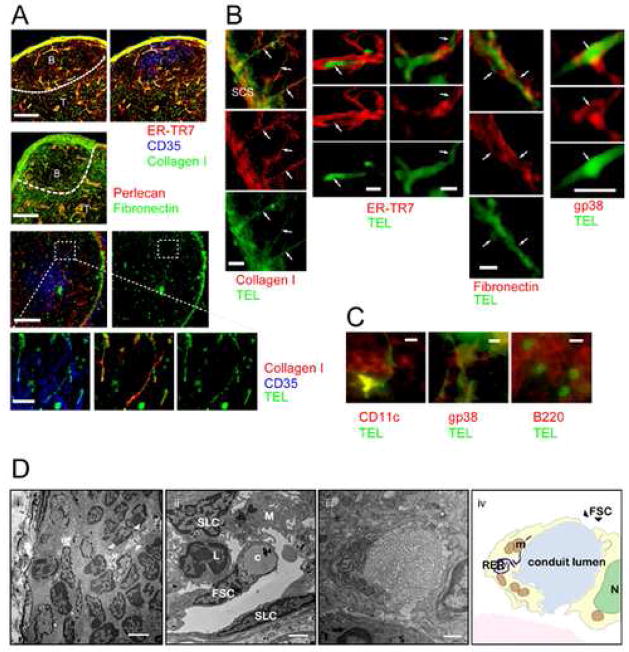
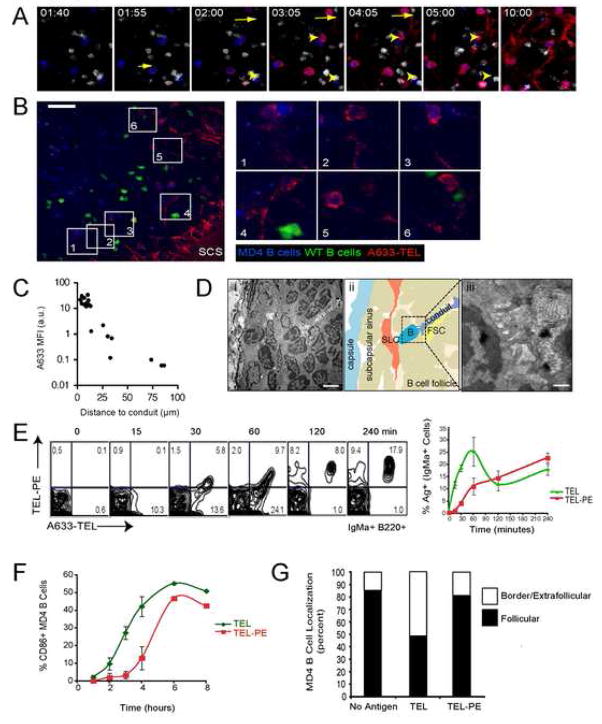
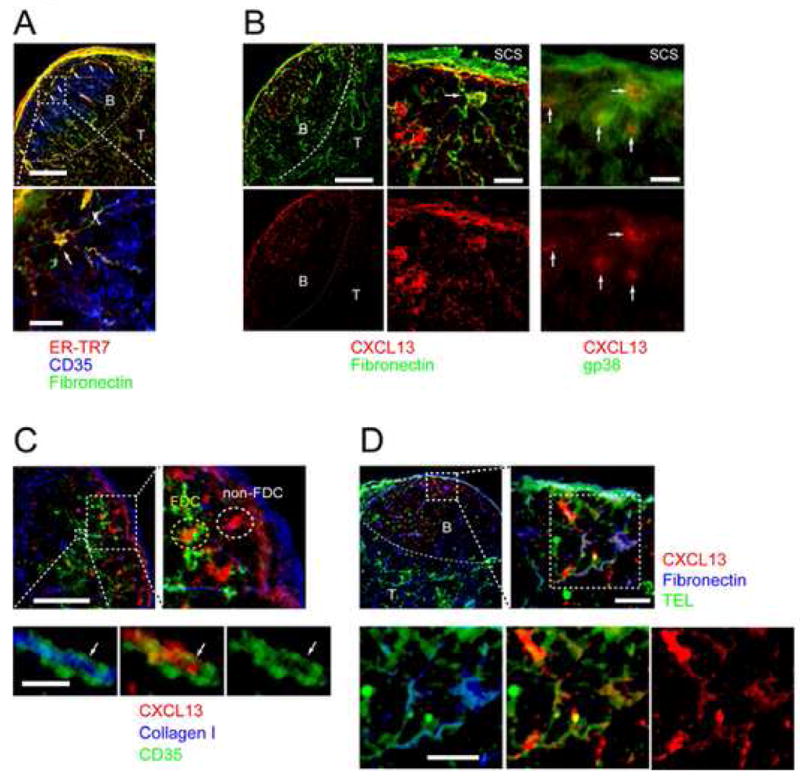
To track drainage of lymph-borne small and large antigens (Ags) into the peripheral lymph nodes and subsequent encounter by B cells and follicular dendritic cells, we used the approach of multiphoton intravital microscopy. We find a system of conduits that extend into the follicles and mediate delivery of small antigens to cognate B cells and follicular dendritic cells. The follicular conduits provide an efficient and rapid mechanism for delivery of small antigens and chemokines such as CXCL13 to B cells that directly contact the conduits. By contrast, large antigens were bound by subcapsular sinus macrophages and subsequently transferred to follicular B cells as previously reported. In summary, the findings identify a unique pathway for the channeling of small lymph-borne antigens and chemoattractants from the subcapsular sinus directly to the B cell follicles. This pathway could be used for enhancing delivery of vaccines or small molecules for improvement of humoral immunity.


Figures

Figure 1
Figure 1
Uptake of Ag on FDC in peripheral LNs is size dependent. (A) Confocal fluorescence micrographs of histological sections of pLNs show delay of KLH deposition on FDC (Blue, Cy5-anti-CD35) relative to TEL, 6 hrs after injection of IC. Scale bar represents 50 μm. Images are representative of at least 3 independent experiments. (B, C) Immunized mice were left untreated (t=0) or injected with a mixture of 10 μg TEL Alexa 488 and 10 μg B-PE s.c. in the hindflanks. (B)The draining inguinal LNs were removed at various times and the deposition of IC on FDC was analyzed by confocal microscopy using a monoclonal antibody specific for CD35 to label FDCs. (C) In vivo uptake of IC containing small or large Ags by polyclonal B cells was analyzed by FACS. The percentages of B220+ cells that have acquired TEL-IC or PE-IC are indicated and are represented in the graph as the mean values ± SEM from at least three LNs. CD45.1+ cells were added during processing of inguinal LNs from CD45.2+ recipient mice to control for ex vivo capture of IC. Statistical significance was determined using a one-tailed, paired Student’s t-test.
Figure 2
Figure 2
Small Ags are rapidly delivered to LN follicles through FO conduits. A633-TEL (red, containing 50 ng TEL) and TEL-PE (green, containing 5 μg TEL) were injected into the footpads of mice and their entry into the draining LN monitored by MP-IVM (See also Movie S1). (A) Intravital micrographs depicting the distribution of the small (A633-TEL, red) and large (TEL-PE, green) Ag in a B follicle early (55 sec., left panel) or late (16 min., 40 sec, right panel) after footpad injection. (WT B = white; MD4 B = blue) Scale bar = 30 μm. (B) Micrographs from selected time-points depicting either A633-TEL or TEL-PE. Time in minutes and seconds. (C) Regions of interest (ROIs) were defined to measure the mean fluorescence intensity (MFI; individually normalized, averaged MFIs ± SEM vs. time after TEL injection) of A633-TEL and TEL-PE in the subcapsular sinus (SCS), conduits (Cd. 1–3), and in the interstitial space (Int. 1–3). Dotted lines indicate half-maximal values for TEL and TEL-PE in conduits and interstitium. (D) ROIs with increasing distance from the SCS were defined and the normalized MFIs of A633-TEL (top panel) and TEL-PE (bottom panel) plotted against time after injection. This experiment was repeated twice with similar results.
Figure 3
Figure 3
Characterization of the FO conduits network by immunohistology and EM. (A) Imaging of thick cryosections (40 μm) stained for collagen I (green) and ER-TR7 (red) (top panels) or fibronectin (green) and perlecan (red) (middle panels) in B cell follicles. Scale bars are 100 μm. Hatched lines indicate the T-B border. Bottom panels: Imaging of thick cryosections after s.c. injection of Ag (TEL, green; collagen I, red and CD35, blue). Hatched box identifies area magnified in lower panels. Scale bars are 100 μm and 20 μm respectively. (B) Immunofluoresence on thin cryosections (10 μm) of LN after s.c. injection of Ag (TEL, green). Left column: collagen I, (red). Scale bar is 20 μm. 2nd and 3rd column: ER-TR7 (red), 4th column: fibronectin (red,) and 5th column: gp38 (red). Scale bars are 5 μm. (C) Ag transported via conduits is acquired by T cell area dendritic cells (CD11c, left panel, red), FSC (gp38, middle panel, red) and B cells (B220, right panel, red). Scale bars are 5 μm. (D) Ultrastructural characterization of FO conduits. (i) Transmission EM of the SCS and the B cell follicle. The white arrowheads indicate part of a conduit in the B cell follicle. Scale bar is 1 μm. (ii) Electron micrograph of a conduit (c) in the SCS area. FSC, SLC and M represent follicular stromal cell, sinus lining cell and macrophage, respectively. Scale bar is 2 μm. (iii) Electron micrograph and schematic drawing (iv) of a transverse section of a FSC located in the follicular area of the LN. The high metabolic activity of these cells is indicated by the presence of a prominent rough endoplasmic reticulum (RER) and mitrochondria (m); N represents nucleus. Scale bar is 500 nm.
Figure 4
Figure 4
Delivery of Ag to B cell by FO conduits leads to B cell activation. (A) A subregion of the same dataset as shown in Figure 2 is shown at different time-points. Short arrow indicates initial appearance of A633-TEL on a B cell in this region. Long arrow indicates a conduit in which A633-TEL is first detected. Arrowhead indicates MD4 B cells that remain free of or accumulate only minute amounts of A633-TEL. Time is shown in minutes and seconds. See also Movie S2. (B) A limiting amount of A633-TEL (red, containing 10 ng TEL) was injected into the footpad of a different mouse seeded with MD4 (blue) and WT B cells (green) and the draining LN monitored by MP-IVM (See also Movie S3) and the micrograph taken 170 sec after TEL injection. Magnified regions of interest highlight the close spatial relation of selected TEL+ MD4 B cells to TEL-containing conduits. Scale bar = 30 μm. (C) Quantification of TEL uptake by MD4 B cells (as measured by MFI) as a function of proximity to the nearest TEL+ conduit. Similar results were obtained in a separate experiment. (D) Electron micrographs of a B cell follicle (i and iii) and schematic drawing (ii) showing B cell processes in close contact with a conduit. The SLC that separate the SCS from the B cell follicle are indicated in orange. Scale bars are 1μm (i) and 500 nm (iii). (E) The acquisition of A633-TEL versus TEL-PE by MD4 B cells was assessed over a four hr period by FACS. Representative plots, gated on IgMa+ cells that acquired Ag in vivo (labelled MD4 cells were added ex vivo to capture free Ag), from four LNs analyzed in two experiments are shown. Average values ± SEM of Ag acquisition by MD4 B cells are shown in the graph. *p=0.004. **p=0.03. (F) Upregulation of CD86 on MD4 B cells by TEL or TEL-PE. The percentage of MD4 B cells expressing CD86 at 1, 2, 3, 4, 6 and 8 hrs after Ag injection. Average values ± SEM from at least two LNs from three experiments are shown. (G) Location of MD4 B cells in the inguinal LNs of mice that received no Ag, TEL or TEL-PE 8 hrs earlier. Results from two experiments were analyzed for the numbers of MD4 B cells localized to two zones, within the follicles, or in a ROI within 22 μm of the paracortical/follicular border or extrafollicular, and used to compile the graph.
Figure 5
Figure 5
CXCL13 is associated with FO conduits. Immunofluorescence micrographs of B cell follicles stained with antibodies against (A) Fibronectin (green), ER-TR7 (red) and CD35 (blue). T-B boundaries are indicated by hatched lines. Scale bars are 100 μm (top) and 20 μm (bottom). (B) LN cryosections stained for CXCL13 (red), fibronectin (green, left and middle columns, scale bars are 100 and 20 μm) and gp38 (green, right column, scale bar is 20 μm). (C) Localization of CXCL13 (red) in the follicles: collagen I (blue), CD35 (green). Hatched boxes indicate magnified areas. Scale bars are 100 μm for overview and 20 μm and 5 μm for large and small magnified area respectively. (D) Location of Ag and CXCL13 in LN follicles. Ag (TEL, green), CXCL13 (red) and fibronectin (blue). Hatched boxes indicate magnified areas. Scale bars are 100 μm for overview and 20 μm for magnified areas.

Comment in

Similar articles

Cited by

References

    1. Allen CD, Cyster JG. Follicular dendritic cell networks of primary follicles and germinal centers: phenotype and function. Semin Immunol. 2008;20:14–25. - PMC - PubMed
    1. Allen CD, Okada T, Tang HL, Cyster JG. Imaging of germinal center selection events during affinity maturation. Science. 2007;315:528–531. - PubMed
    1. Bajenoff M, Egen JG, Koo LY, Laugier JP, Brau F, Glaichenhaus N, Germain RN. Stromal cell networks regulate lymphocyte entry, migration, and territoriality in lymph nodes. Immunity. 2006;25:989–1001. - PMC - PubMed
    1. Berney C, Herren S, Power CA, Gordon S, Martinez-Pomares L, Kosco-Vilbois MH. A member of the dendritic cell family that enters B cell follicles and stimulates primary antibody responses identified by a mannose receptor fusion protein. J Exp Med. 1999;190:851–860. - PMC - PubMed
    1. Carrasco YR, Batista FD. B cells acquire particulate antigen in a macrophage-rich area at the boundary between the follicle and the subcapsular sinus of the lymph node. Immunity. 2007;27:160–171. - PubMed

Publication types