. 2009 Jan 23;136(2):352-63.
doi: 10.1016/j.cell.2008.11.038.

Large-scale structural analysis of the classical human protein tyrosine phosphatome

Affiliations

Large-scale structural analysis of the classical human protein tyrosine phosphatome

Alastair J Barr et al. Cell. .

Abstract

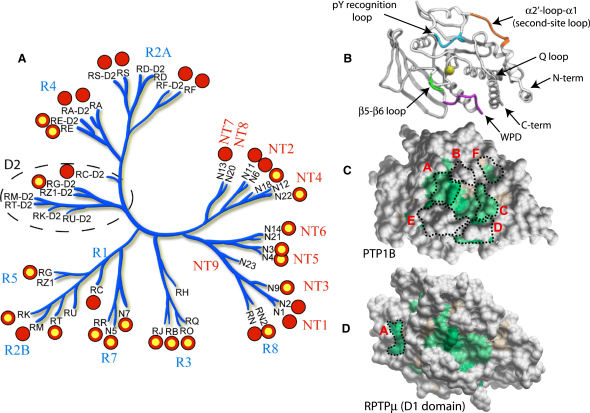
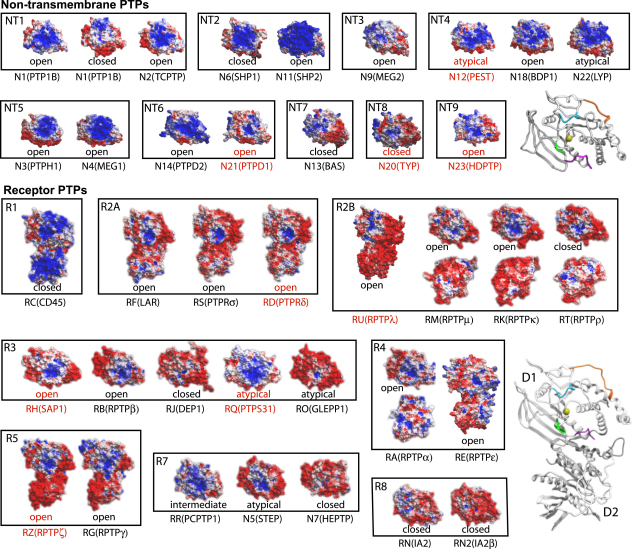
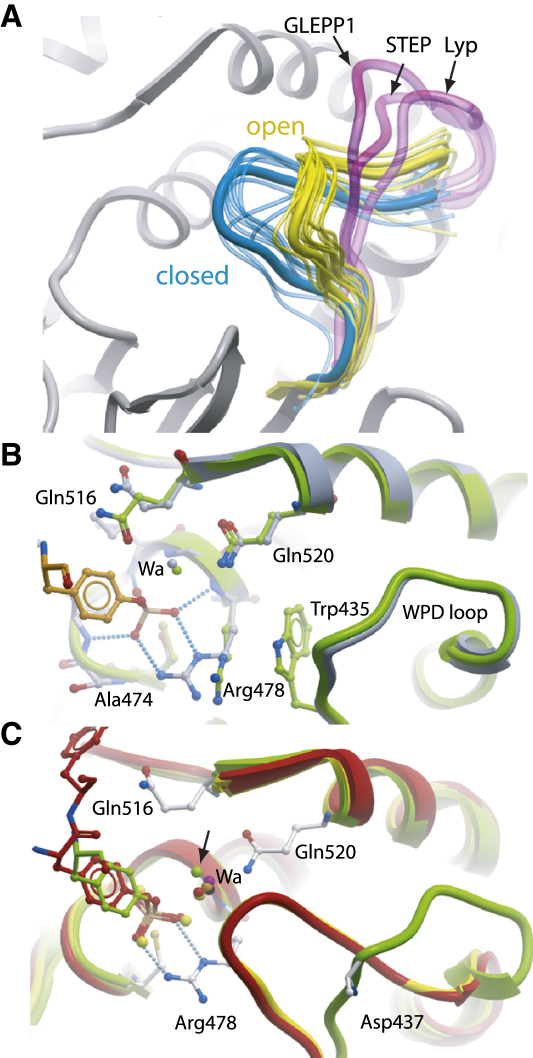
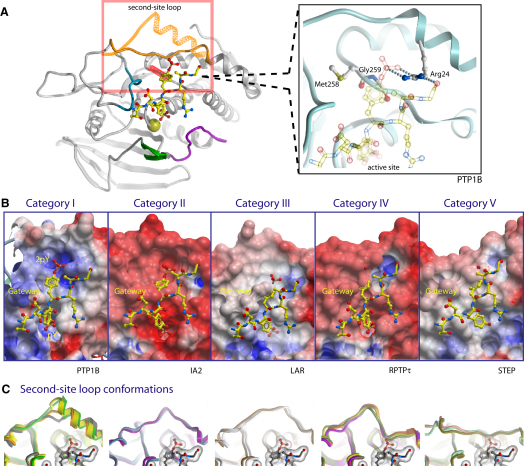
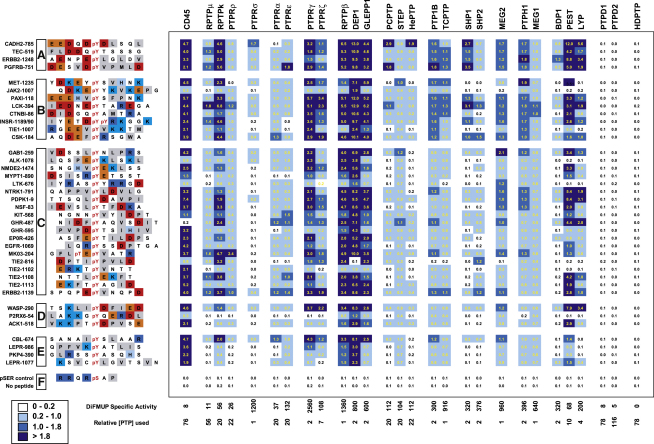
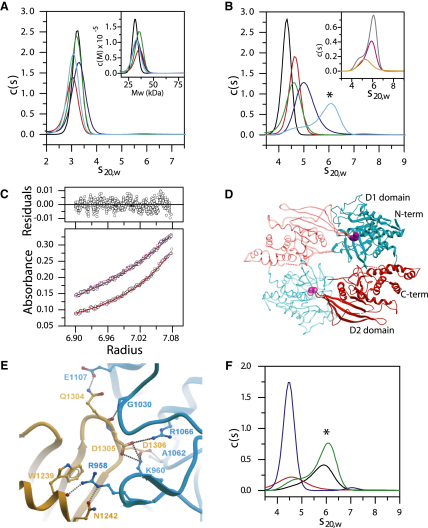
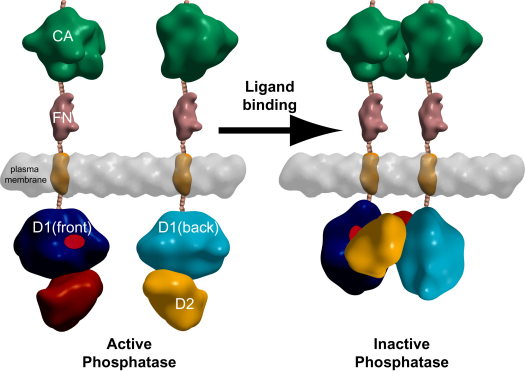
Protein tyrosine phosphatases (PTPs) play a critical role in regulating cellular functions by selectively dephosphorylating their substrates. Here we present 22 human PTP crystal structures that, together with prior structural knowledge, enable a comprehensive analysis of the classical PTP family. Despite their largely conserved fold, surface properties of PTPs are strikingly diverse. A potential secondary substrate-binding pocket is frequently found in phosphatases, and this has implications for both substrate recognition and development of selective inhibitors. Structural comparison identified four diverse catalytic loop (WPD) conformations and suggested a mechanism for loop closure. Enzymatic assays revealed vast differences in PTP catalytic activity and identified PTPD1, PTPD2, and HDPTP as catalytically inert protein phosphatases. We propose a "head-to-toe" dimerization model for RPTPgamma/zeta that is distinct from the "inhibitory wedge" model and that provides a molecular basis for inhibitory regulation. This phosphatome resource gives an expanded insight into intrafamily PTP diversity, catalytic activity, substrate recognition, and autoregulatory self-association.


Figures

Figure 1
Figure 1
Structural Coverage of the PTPome and Surface Diversity (A) Phylogenetic tree of human PTP D1 and D2 domains indicating crystal structures determined (SGC Oxford structures are highlighted in yellow). Details of other PTP structures can be found at http://www.sgc.ox.ac.uk/research/phosphatases. PTPs are grouped into receptor PTPs (groups R1–R8) and nontransmembrane PTPs (groups NT1–NT9). The abbreviated Human Genome Organisation (HUGO: http://www.genenames.org/) gene symbol nomenclature is used in the tree, and the corresponding common names and PDB codes are provided in Supplemental Data. (B) Ribbon diagram of PTP1B with labeling of key secondary structural elements. The Cα of the catalytic cysteine residue is shown as a space-filling CPK model. (C) Conserved residues from a structure-based alignment of nonreceptor PTPs mapped onto the surface of PTP1B. Green: highly conserved, light brown: conserved residue properties only, and gray: nonconserved. (D) Conserved residues from a structure-based alignment of receptor PTPs mapped onto the surface of RPTPμ.
Figure 2
Figure 2
Diversity in Surface Electrostatic Potential across the PTPome Surface representations showing the calculated electrostatic potential (rendered in ICM) of PTP family members from crystal structures (black) and homology models (red). The colors of surface elements were capped at ±3 kcal/electron units (+3 = blue; −3 = red) when the calculated potentials were transferred to the surface. The WPD loop conformation is indicated under each structure.
Figure 3
Figure 3
Novel Conformations and Movement of the Catalytic (WPD) Loop (A) WPD loop conformations are shown by a PTP representative of each state: closed (blue, PTP1B, PDB: 1SUG); open (yellow, PTP1B, PDB: 2HNP); and atypical (magenta, GLEPP1, PDB: 2GJT; STEP, PDB: 2BIJ; Lyp, PDB: 2P6X). The intermediate WPD loop conformation of PCPTP1 (PDB: 2A8B) is not shown for clarity. Other PTP structures are shown with a thin transparent line tracing the backbone and are colored according to conformation. (B) Superimposition of the structure of STEP-C/S in complex with pY (PDB: 2CJZ; gray) and the apo STEP (PDB: 2BIJ; light green) showing that the WPD loop conformation does not change on substrate binding (pTyr, orange). The catalytic water molecule (Wa) corresponding to that found in closed structures is shown. (C) Superimposition of the structure of STEP-C/S in complex with pY (PDB: 2CJZ; green) and PTP1B with the insulin receptor peptide (PDB: 1G1H; red). The conserved water molecule found in closed structures is shown: PTP1B (1SUG, yellow); GLEPP1 (2G59, orange); HePTP (2A3K, black), DEP1 (2NZ6, magenta). The arrow indicates the position of the displaced water molecule in STEP-C/S structure.
Figure 4
Figure 4
Secondary Substrate-Binding Pockets (A) Two extreme conformations of the second-site loop are shown (orange) from RPTPγ (extended helix) and HEPTP (closed in conformation). The catalytic cysteine is shown in a space-filling CPK representation, and loops are colored as follows: WPD (magenta), β5/β6 loop (green), and gateway (red). The dually pTyr phosphorylated insulin receptor peptide (from PDB: 1G1H) is shown superimposed (for reference only) to indicate the position of the secondary substrate-binding pocket. The positions of Arg24 and gateway residues Met258 and Gly259 of PTP1B are shown in an enlarged view. (B) Surface topology and electrostatic charge for the active site (pY), gateway region, and secondary pocket (2pY) are shown for each of the five categories with the dually pTyr phosphorylated insulin receptor peptide superimposed. (C) Representative second-site loop conformations are shown for each category (see also Supplemental Data). Category I: SHP2, BDP1, LYP; Category II: IA2, IA2β; Category III: LAR, RPTPσ; Category IV: PTPH1, MEG1, PTPD2, CD45; Category V: STEP, HEPTP, PCPTP1.
Figure 5
Figure 5
Analysis of PTP In Vitro Substrate Specificity Phosphatase activity of PTP catalytic domains against a panel of phosphopeptides derived from potential physiological substrates. Calculated reactions rates (Abs360/s) measured over control (a pSer-containing peptide and no peptide) have been color-coded with higher rates represented by darker shades of blue. Initial linear reaction rates were measured using the EnzCheck coupled continuous spectrophotometric assay over ∼5 min. Phosphopeptide names are derived from the SwissProt human gene name and the number of the pY residue. Sequences have been grouped based on sequence characteristics relative to the position of the pTyr: (A) N-terminal acidic; (B) N-terminal acidic and C-terminal basic; (C) mixed; (D) N-terminal basic and C-terminal acidic; (E) mixed basic; and (F) controls.
Figure 6
Figure 6
Self-Association of PTPs and Dimerization of RPTPγ (A) Sedimentation velocity AUC measurements of single-domain PTPs: IA2 (red); GLEPP1 (dark blue); DEP1 (green); IA2β (black); STEP (light blue). Differential sedimentation coefficient distribution, c(s), is plotted versus the apparent sedimentation coefficient corrected to water at 20°C, s20,w, together with the differential molecular weight distribution, c(M), versus molecular weight, M (inset). Experiments were conducted with a protein concentration of 0.8 mg/ml (∼24 μM). (B) Sedimentation velocity AUC measurements of tandem-domain RPTPs: RPTPα (black); CD45 (red); RPTPɛ (green); RPTPμ (dark blue); RPTPγ (light blue). Plotted data are as in (A). Inset shows experiments conducted with RPTPγ at protein concentrations of 0.2 (orange), 0.4 (magenta), and 0.8 (black) mg/ml. The dimer peak is indicated by an asterisk (). (C) Sedimentation equilibrium analysis of RPTPγ employing a rotor speed of 7500 (black) and 10,000 rpm (red). The solid line denotes a fitted curve resulting from global nonlinear regression analysis with a self-association model. The residuals for the fit are shown in the upper panel of the graph. The determined dissociation constant for the dimer was (KD) of 3.5 ± 0.3 μM. (D) Dimer interface in the crystal structure of RPTPγ. The two molecules interact in a head-to-toe orientation with the D1 domain (blue) of one molecule interacting with the D2 domain (red) of a second molecule. The catalytic cysteine (magenta) of the D1 domain is shown in a space-filling representation. (E) Details of the RPTPγ dimer interface. The backbone of the D1 domain from one molecule is colored blue and the backbone of the D2 domain from the interacting molecule is colored orange. H-bonds (black) and salt-bridges (gray) are depicted as dotted lines. See Supplemental Data for further details. (F) Disruption of the RPTPγ dimer interface by site-directed mutagenesis. The figure shows sedimentation velocity data using wild-type RPTPγ and RPTPγ dimer interface mutants. RPTPγ wild-type 0.8 mg/ml (green) and 0.4 mg/ml (black); RPTPγ-RKEE mutant 0.8 mg/ml (blue) and RPTPγ-DDKK mutant 0.4 mg/ml (red) are shown. The dimer peak is indicated by an asterisk ().
Figure 7
Figure 7
Schematic Model of RPTPγ Dimerization-Induced Inactivation The proposed transition of RPTPγ from monomer to dimer on ligand binding is shown. The carbonic anhydrase (CA), fibronection (FN), and intracellular tandem phosphatase (D1 and D2) domains are represented as low-resolution surfaces. Surface representations are based on PDB codes: 1JDO for the carbonic anhydrase domain, 2GEE for the fibronectin domain, and 2NLK for the tandem-phosphatase domain. In the monomeric state, the active site of RPTPγ (red) is accessible and the phosphatase is active. Ligand binding to the extracellular part of RPTPγ brings two molecules into close proximity and consequently the phosphatase domains dimerize in a head-to-toe arrangement as in the RPTPγ crystal structure with the D2 domain of one molecule blocking the active site (D1) from a second molecule, leading to suppression of phosphatase activity.

Comment in

  • The PTP family photo album.
    Tremblay ML. Tremblay ML. Cell. 2009 Jan 23;136(2):213-4. doi: 10.1016/j.cell.2009.01.006. Cell. 2009. PMID: 19167325

Similar articles

Cited by

References

    1. Almo S.C., Bonanno J.B., Sauder J.M., Emtage S., Dilorenzo T.P., Malashkevich V., Wasserman S.R., Swaminathan S., Eswaramoorthy S., Agarwal R. Structural genomics of protein phosphatases. J. Struct. Funct. Genomics. 2007;8:121–140. - PMC - PubMed
    1. Alonso A., Sasin J., Bottini N., Friedberg I., Friedberg I., Osterman A., Godzik A., Hunter T., Dixon J., Mustelin T. Protein tyrosine phosphatases in the human genome. Cell. 2004;117:699–711. - PubMed
    1. Andersen J.N., Mortensen O.H., Peters G.H., Drake P.G., Iversen L.F., Olsen O.H., Jansen P.G., Andersen H.S., Tonks N.K., Moller N.P. Structural and evolutionary relationships among protein tyrosine phosphatase domains. Mol. Cell. Biol. 2001;21:7117–7136. - PMC - PubMed
    1. Aricescu A.R., Siebold C., Choudhuri K., Chang V.T., Lu W., Davis S.J., van der Merwe P.A., Jones E.Y. Structure of a tyrosine phosphatase adhesive interaction reveals a spacer-clamp mechanism. Science. 2007;317:1217–1220. - PubMed
    1. Barford D., Das A.K., Egloff M.P. The structure and mechanism of protein phosphatases: insights into catalysis and regulation. Annu. Rev. Biophys. Biomol. Struct. 1998;27:133–164. - PubMed

Publication types

Substances