. 2009 Jan;5(1):e1000324.
doi: 10.1371/journal.pgen.1000324. Epub 2009 Jan 2.

ATR and Chk1 suppress a caspase-3-dependent apoptotic response following DNA replication stress

Affiliations

ATR and Chk1 suppress a caspase-3-dependent apoptotic response following DNA replication stress

Katie Myers et al. PLoS Genet. 2009 Jan.

Abstract

The related PIK-like kinases Ataxia-Telangiectasia Mutated (ATM) and ATM- and Rad3-related (ATR) play major roles in the regulation of cellular responses to DNA damage or replication stress. The pro-apoptotic role of ATM and p53 in response to ionizing radiation (IR) has been widely investigated. Much less is known about the control of apoptosis following DNA replication stress. Recent work indicates that Chk1, the downstream phosphorylation target of ATR, protects cells from apoptosis induced by DNA replication inhibitors as well as IR. The aim of the work reported here was to determine the roles of ATM- and ATR-protein kinase cascades in the control of apoptosis following replication stress and the relationship between Chk1-suppressed apoptotic pathways responding to replication stress or IR. ATM and ATR/Chk1 signalling pathways were manipulated using siRNA-mediated depletions or specific inhibitors in two tumour cell lines or fibroblasts derived from patients with inherited mutations. We show that depletion of ATM or its downstream phosphorylation targets, NBS1 and BID, has relatively little effect on apoptosis induced by DNA replication inhibitors, while ATR or Chk1 depletion strongly enhances cell death induced by such agents in all cells tested. Furthermore, early events occurring after the disruption of DNA replication (accumulation of RPA foci and RPA34 hyperphosphorylation) in ATR- or Chk1-depleted cells committed to apoptosis are not detected in ATM-depleted cells. Unlike the Chk1-suppressed pathway responding to IR, the replication stress-triggered apoptotic pathway did not require ATM and is characterized by activation of caspase 3 in both p53-proficient and -deficient cells. Taken together, our results show that the ATR-Chk1 signalling pathway plays a major role in the regulation of death in response to DNA replication stress and that the Chk1-suppressed pathway protecting cells from replication stress is clearly distinguishable from that protecting cells from IR.


Conflict of interest statement

The authors have declared that no competing interests exist.

Figures
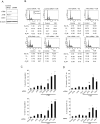
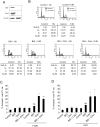
Figure 1
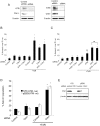
Figure 1. Effects of ATM, ATR or Chk1 depletion on the induction of apoptosis following replication fork stress.
A) Protein levels 48 hours after transfection of the indicated siRNAs in HCT116 cells. β-actin levels are presented as a loading control. B) Representative cell cycle distributions of HCT116 cultures transfected with indicated siRNAs 24 hours before treatment with 2 mM thymidine or 0.5 mM hydroxyurea for 48 hours. Shaded profiles represent control cultures not treated with replication inhibitors, unshaded profiles represent cultures treated with HU or thymidine (TdR). C & D) Cultures of HCT116 cells transfected with the indicated siRNAs were treated 2 mM thymidine or 0.5 mM HU for 48 hours or left untreated as controls. Cells were then harvested and the level of apoptosis was determined by measuring the percentage of cells containing a subG1 DNA content by flow cytometry (C) or the percentage of the population binding Annexin V but not PI (D). Results in C and D represent the means of two to three independent experiments±standard deviations. Statistical significance versus thymidine or HU treated control siRNA transfected cells: ns, not significant; *p<.05; **p<.005; ***p<.005.
Figure 2
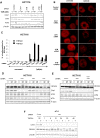
Figure 2. Effects of co-depletions of ATM, ATR or Chk1 on apoptosis in response to replication inhibitors.
A) ATR and Chk1 protein levels 48 hours after transfection of the indicated combinations of siRNAs in HCT116 cells. β-actin levels are presented as loading controls. B & C) Level of apoptotic cells in HCT116 cultures (measured by Annexin V binding) after transfection of the indicated siRNAs following a 48 hour treatment with 2 mM thymidine. D) Induction of apoptosis (measured as the sub-G1 population) in ATM corrected YZ5 or ATM deficient pEBS cells transfected with control or Chk1 siRNAs and treated or not treated with 2 mM thymidine for 48 hours. E) Western blot analysis of Chk1 protein levels in the ATM-deficient pEBS or corrected YZ5 cells after 48 hours treatment with the relevant siRNA. β-actin levels are presented as loading controls. Results in B–D represent the means of two to three independent experiments±standard deviations. Statistical significance versus thymidine or HU treated control siRNA transfected cells: ns, not significant; *p<.05.
Figure 3
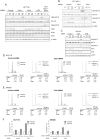
Figure 3. Induction of RPA foci and RPA34 hyperphosphorylation in cells depleted of Chk1 or ATR but not ATM deficient cells following thymidine treatment.
A) Levels of Chk1, ATR, or ATM proteins following treatment of HCT116 cells with the indicated siRNAs or 10 µM of the ATM inhibitor (KU55399). B) Representative images of RPA foci obtained by immunostaining of HCT116 cells treated with control, Chk1, ATR, or ATM siRNAs or 10 µM of the ATM inhibitor KU55399 after a 24 hour thymidine treatment. C) Percentages of cells treated with the indicated siRNAs or 10 µM of the ATM inhibitor KU55399 presenting low (<10 foci/cell) or high (>10 foci/cell) levels of RPA foci after a 24 hour exposure to thymidine. D) Western blot analysis of RPA34, Chk1, ATR and ATM in extracts from HCT116 cells transfected with the indicated siRNAs and exposed to 2 mM thymidine for the indicated times. The band showing slower mobility on panel probed with the RPA34 antibody represents hyperphosphorylated forms of the protein. E) Hyperphosphorylation of RPA34 in HCT116 cells co-depleted of Chk1 and ATM after exposure to 2 mM thymidine for the indicated times. F) Hyperphosphorylation of RPA34 in the AT fibroblast line AT5 transfected with control or Chk1 siRNAs following exposure to 2 mM thymidine for the indicated times. Hyperphosphorylated RPA34 was detected by six hours after thymidine treatment. AT5 cells treated with the control siRNA do not show the slower mobility band characteristic of RPA34 hyperphosphorylation following a 30 hour thymidine treatment.
Figure 4
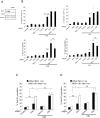
Figure 4. Induction of caspase 3 cleavage in HCT116 cells depleted of Chk1 following thymidine treatment.
A) Western blot analysis of caspase 2 (c2) and cleaved caspase 3 (c3) in extracts obtained from HCT116 cells transfected with the indicated siRNAs treated or not treated with 2 mM thymidine for the indicated times. The two lanes furthest to the right present caspase 2 and cleaved caspase 3 levels in HCT116 p53−/− cells depleted of Chk1 exposed or not exposed to 10 Gy IR. The levels of Chk1, ATR and ATM in the cells treated with the indicated siRNAs are presented. β-actin levels are presented as loading controls. B) Western blot analysis of caspase 2 and cleaved caspase 3 in extracts obtained from HCT116 p53−/− cells transfected with control or Chk1 siRNAs and treated or not treated with 2 mM thymidine for the indicated times. As above, the two lanes furthest to the right present caspase 2 and cleaved caspase 3 levels in HCT116 p53−/− cells depleted of Chk1 exposed or not exposed to 10 Gy IR. The levels of Chk1 in the cells treated with the indicated siRNAs are presented. C) Western blot analysis of cleaved caspase 2 and cleaved caspase 3 in extracts obtained from SW480 cells transfected with control, Chk1, or ATM siRNAs and treated or not treated with 2 mM thymidine for the indicated times. D–E) Cell cycle analysis of HCT116 (D) or SW480 (E) cells transfected with the indicated siRNAs and treated or not treated with 2 mM thymdine for 48 hours. The indicated cultures were also treated with 100 mM of the caspase 3 inhibitor II, Z-DEVD-FMK. F) HCT116 and SW480 cultures treated as above were also assayed for AnnexinV+/PI negative cells.
Figure 5
Figure 5. Effect of Nbs1 deficiency on apoptosis in response to replication inhibitors.
A) Nbs1 and Chk1 protein levels in HCT116 cells after 48 hours treatment with the siRNAs for the two proteins. B) Induction of apoptosis measured by Annexin V staining (top panels) or sub-G1 population (bottom panels) in HCT116 cells transfected with control, Nbs1 or Chk1 siRNAs singly or in combination exposed or not exposed to 2 mM thymidine or 0.5 mM hyroxyurea. C & D) Induction of apoptosis (measured by the percentage of cells with a sub-G1 DNA content) in Nbs1-deficient (LB1) and corrected (p95wt) fibroblasts transfected with control or Chk1 siRNA following exposure to 2 mM thymidine (C) or 0.5 mM hyroxyurea (D). Results in B–D represent the means of two to three independent experiments±standard deviations. Statistical significance versus thymidine or HU treated control siRNA transfected cells: ns, not significant; *p<.05; **p<.005; ***p<.005.
Figure 6
Figure 6. Effect of BID depletion on the induction of apoptosis following disruption of replication.
A) Western blot analysis of Chk1 and BID in HCT116 cells treated with control, Chk1 and/or BID siRNAs for 48 hours. β-actin levels are presented as loading controls. B) Representative cell cycle distributions of HCT116 cells transfected with the indicated siRNAs followed by treatment with 2 mM thymidine or 0.5 mM hydroxyurea for 48 hours. Shaded profiles represent control cultures not treated with replication inhibitors, unshaded profiles represent cultures treated with HU or thymidine (TdR). C & D) Induction of apoptosis (measured by Annexin V binding) in HCT116 cells following transfection of the indicated siRNAs exposed or not exposed to 2 mM thymidine (C) or 0.5 mM HU (D) for 48 hours. Results in C & D represent the means of two to three independent experiments±standard deviations. Statistical significance versus thymidine or HU treated control siRNA transfected cells: ns, not significant; *p<.05; **p<.005.
Figure 7
Figure 7. Model of apoptotic pathways suppressed by Chk1 following IR or DNA replication stress.
Replication stress developing as a result of DSB formation or processing triggers the ATR/Chk1 protein kinase cascade that suppresses an ATM- and ATR-dependent cleavage of caspase 2 and cell death (left, from [19]). Replication stress triggered by DNA replication inhibitors also triggers the ATR/Chk1 protein kinase cascade that suppresses an apoptotic pathway (right). In Chk1 depleted cells treated with replication inhibitors RPA foci accumulate, caspase 3 is activated, and apoptosis follows. Once this apoptotic response is triggered in the absence of Chk1 or ATR, it does not require ATM or ATR function, unlike the response to IR. The formation of RPA foci and apoptosis are dependent upon Cdc45 function and are modulated by p21 ,.

Similar articles

Cited by

References

    1. Shiloh Y. ATM and related protein kinases: safeguarding genome integrity. Nat Rev Cancer. 2003;3:155–168. - PubMed
    1. Falck J, Malland N, Syljuasen RG, Bartek J, Lukas J. The ATM-Chk2-Cdc25A checkpoint pathway guards against radioresistant DNA synthesis. Nature. 2001;410:842–847. - PubMed
    1. Falck J, Petrini JH, Williams BR, Lukas J, Bartek J. The DNA damage-dependent intra-S phase checkpoint is regulated by parallel pathways. Nat Genet. 2002;30:290–294. - PubMed
    1. Lim DS, Kim ST, Xu B, Maser RS, Lin J, et al. ATM phosphorylates p95/nbs1 in an S-phase checkpoint pathway. Nature. 2000;404:613–617. - PubMed
    1. Yu J, Zhang L, Hwang PM, Rago C, Kinzler KW, et al. Identification and classification of p53-regulated genes. Proc Natl Acad Sci USA. 1999;96:14517–14522. - PMC - PubMed

Publication types