

Genetically-directed, cell type-specific sparse labeling for the analysis of neuronal morphology
- PMID: 19116659
- PMCID: PMC2605552
- DOI: 10.1371/journal.pone.0004099
Genetically-directed, cell type-specific sparse labeling for the analysis of neuronal morphology
Abstract
Background: In mammals, genetically-directed cell labeling technologies have not yet been applied to the morphologic analysis of neurons with very large and complex arbors, an application that requires extremely sparse labeling and that is only rendered practical by limiting the labeled population to one or a few predetermined neuronal subtypes.
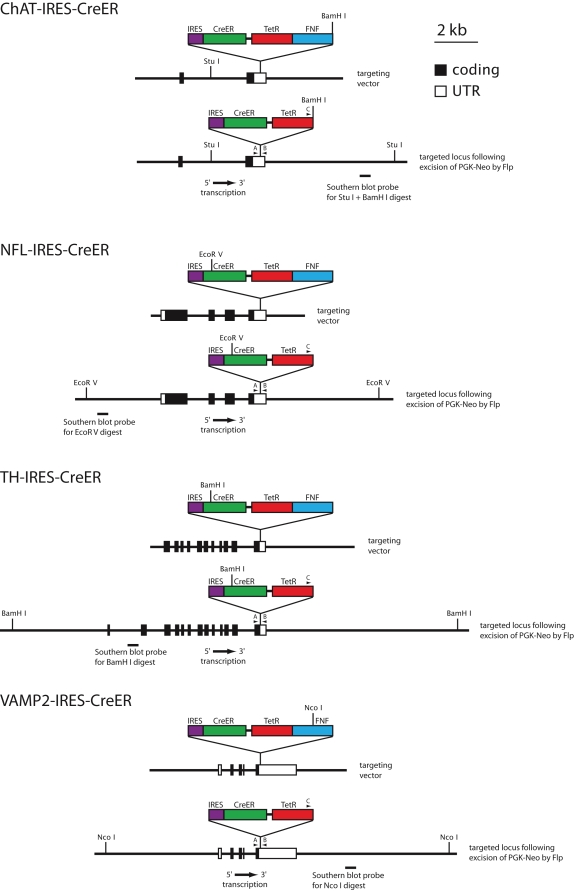
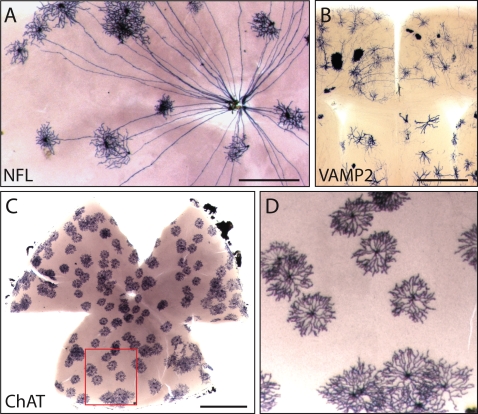
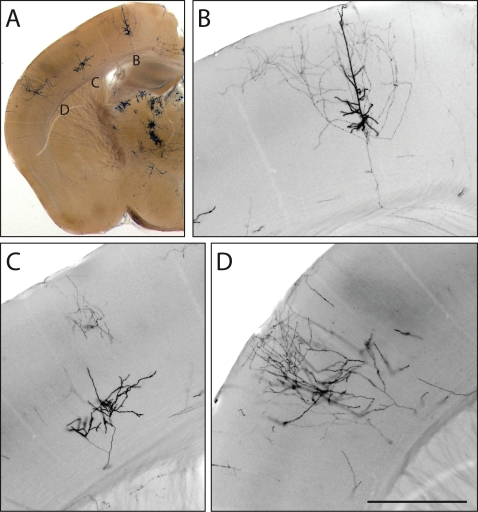
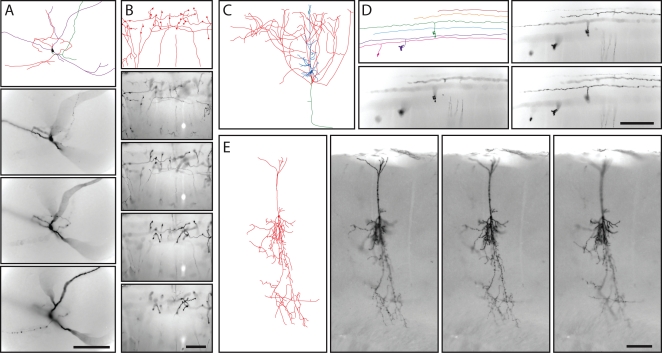
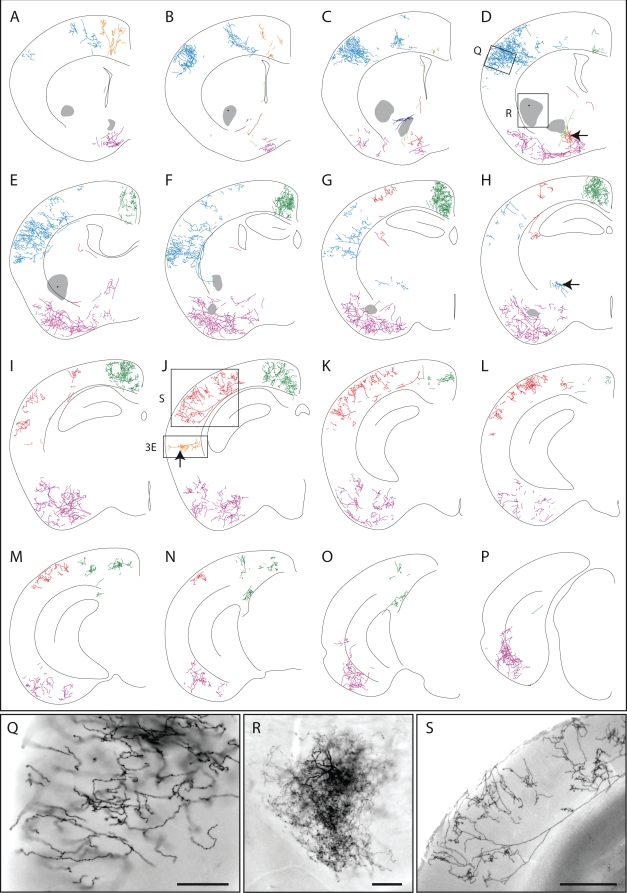
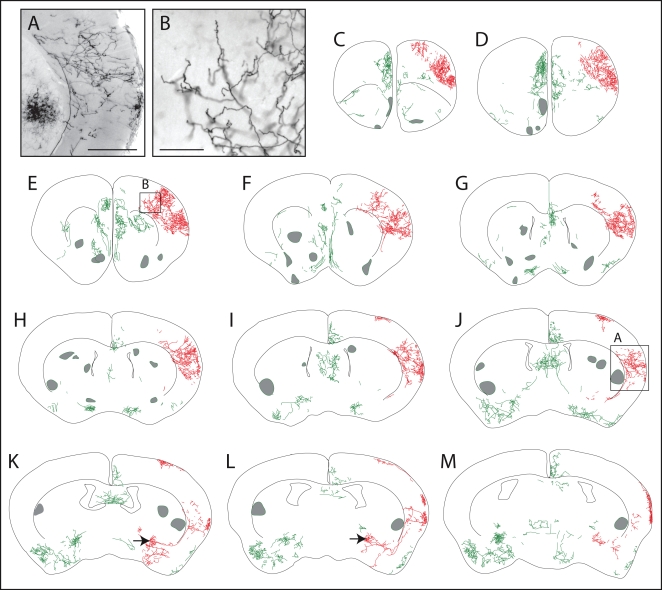
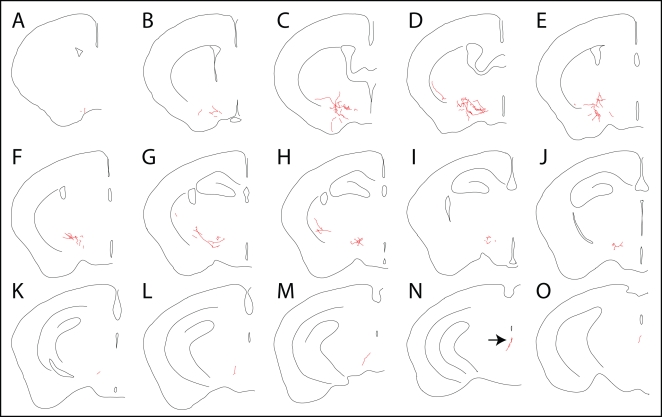
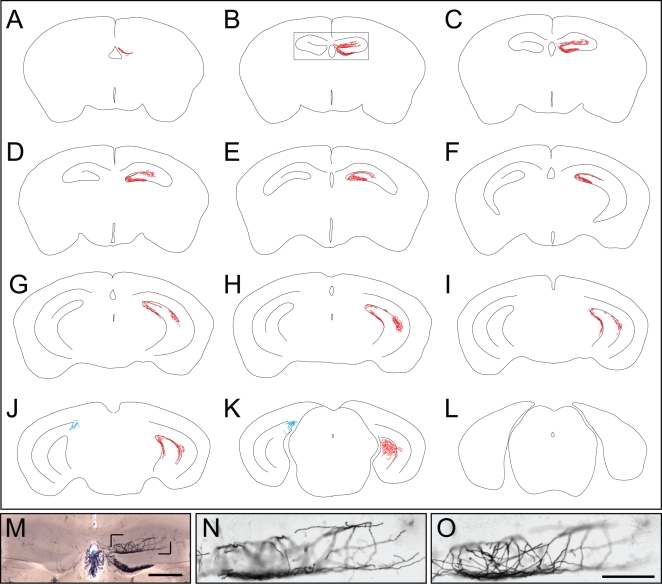
Methods and findings: In the present study we have addressed this application by using CreER technology to non-invasively label very small numbers of neurons so that their morphologies can be fully visualized. Four lines of IRES-CreER knock-in mice were constructed to permit labeling selectively in cholinergic or catecholaminergic neurons [choline acetyltransferase (ChAT)-IRES-CreER or tyrosine hydroxylase (TH)-IRES-CreER], predominantly in projection neurons [neurofilament light chain (NFL)-IRES-CreER], or broadly in neurons and some glia [vesicle-associated membrane protein2 (VAMP2)-IRES-CreER]. When crossed to the Z/AP reporter and exposed to 4-hydroxytamoxifen in the early postnatal period, the number of neurons expressing the human placental alkaline phosphatase reporter can be reproducibly lowered to fewer than 50 per brain. Sparse Cre-mediated recombination in ChAT-IRES-CreER;Z/AP mice shows the full axonal and dendritic arbors of individual forebrain cholinergic neurons, the first time that the complete morphologies of these very large neurons have been revealed in any species.
Conclusions: Sparse genetically-directed, cell type-specific neuronal labeling with IRES-creER lines should prove useful for studying a wide variety of questions in neuronal development and disease.
Conflict of interest statement
Figures
Similar articles
-
New mouse lines for the analysis of neuronal morphology using CreER(T)/loxP-directed sparse labeling.PLoS One. 2009 Nov 16;4(11):e7859. doi: 10.1371/journal.pone.0007859. PLoS One. 2009. PMID: 19924248 Free PMC article.
-
Ultrastructural localization of choline acetyltransferase in the rat rostral ventrolateral medulla: evidence for major synaptic relations with non-catecholaminergic neurons.Brain Res. 1989 Oct 23;500(1-2):67-89. doi: 10.1016/0006-8993(89)90301-6. Brain Res. 1989. PMID: 2575007
-
Cholinergic neurons in the rat septal complex: ultrastructural characterization and synaptic relations with catecholaminergic terminals.J Comp Neurol. 1991 Dec 1;314(1):37-54. doi: 10.1002/cne.903140105. J Comp Neurol. 1991. PMID: 1686777
-
Generation of a ChATCre mouse line without the early onset hearing loss typical of the C57BL/6J strain.Hear Res. 2020 Mar 15;388:107896. doi: 10.1016/j.heares.2020.107896. Epub 2020 Jan 20. Hear Res. 2020. PMID: 31982642 Free PMC article.
-
Localization of choline acetyltransferase-expressing neurons in Drosophila nervous system.Microsc Res Tech. 1999 Apr 15;45(2):65-79. doi: 10.1002/(SICI)1097-0029(19990415)45:2<65::AID-JEMT2>3.0.CO;2-0. Microsc Res Tech. 1999. PMID: 10332725 Review.
Cited by
-
Revisiting a Telencephalic Extent of the Ascending Reticular Activating System.Cell Mol Neurobiol. 2023 Aug;43(6):2591-2602. doi: 10.1007/s10571-023-01339-3. Epub 2023 Mar 25. Cell Mol Neurobiol. 2023. PMID: 36964874 Review.
-
DeepBouton: Automated Identification of Single-Neuron Axonal Boutons at the Brain-Wide Scale.Front Neuroinform. 2019 Apr 18;13:25. doi: 10.3389/fninf.2019.00025. eCollection 2019. Front Neuroinform. 2019. PMID: 31105547 Free PMC article.
-
An Efficient and Versatile System for Visualization and Genetic Modification of Dopaminergic Neurons in Transgenic Mice.PLoS One. 2015 Aug 20;10(8):e0136203. doi: 10.1371/journal.pone.0136203. eCollection 2015. PLoS One. 2015. PMID: 26291828 Free PMC article.
-
Evaluation of a library of loxP variants with a wide range of recombination efficiencies by Cre.PLoS One. 2022 Oct 21;17(10):e0276657. doi: 10.1371/journal.pone.0276657. eCollection 2022. PLoS One. 2022. PMID: 36269789 Free PMC article.
-
Generation of a Spiral Ganglion Neuron Degeneration Mouse Model.Front Cell Dev Biol. 2021 Oct 27;9:761847. doi: 10.3389/fcell.2021.761847. eCollection 2021. Front Cell Dev Biol. 2021. PMID: 34778272 Free PMC article.
References
-
- Ramon y Cajal S. Histologie du systeme nerveux de l'homme at des vertebras. 1911. Paris: Maloine; reprinted 1955, Madrid: Instituto Ramon y Cajal.
-
- Leventhal AG, Rodieck RW, Dreher B. Central projections of cat retinal ganglion cells. J Comp Neurol. 1985;237:216–226. - PubMed
-
- Gan WB, Grutzendler J, Wong WT, Wong RO, Lichtman JW. Multicolor “DiOlistic” labeling of the nervous system using lipophilic dye combinations. Neuron. 2000;27:219–225. - PubMed
-
- Dacey DM, Peterson BB, Robinson FR, Gamlin PD. Fireworks in the primate retina: in vitro photodynamics reveals diverse LGN-projecting ganglion cell types. Neuron. 2003;37:15–27. - PubMed
-
- Szmajda BA, Grünert U, Martin PR. Retinal ganglion cell inputs to the koniocellular pathway. J Comp Neurol. 2008;510:251–268. - PubMed
Publication types
MeSH terms
Substances
Grants and funding
LinkOut - more resources
Full Text Sources
Other Literature Sources
Molecular Biology Databases
