. 2009 Feb 13;104(3):318-27.
doi: 10.1161/CIRCRESAHA.108.181131. Epub 2008 Dec 23.

G2A deficiency in mice promotes macrophage activation and atherosclerosis

Affiliations

G2A deficiency in mice promotes macrophage activation and atherosclerosis

David T Bolick et al. Circ Res. .

Abstract

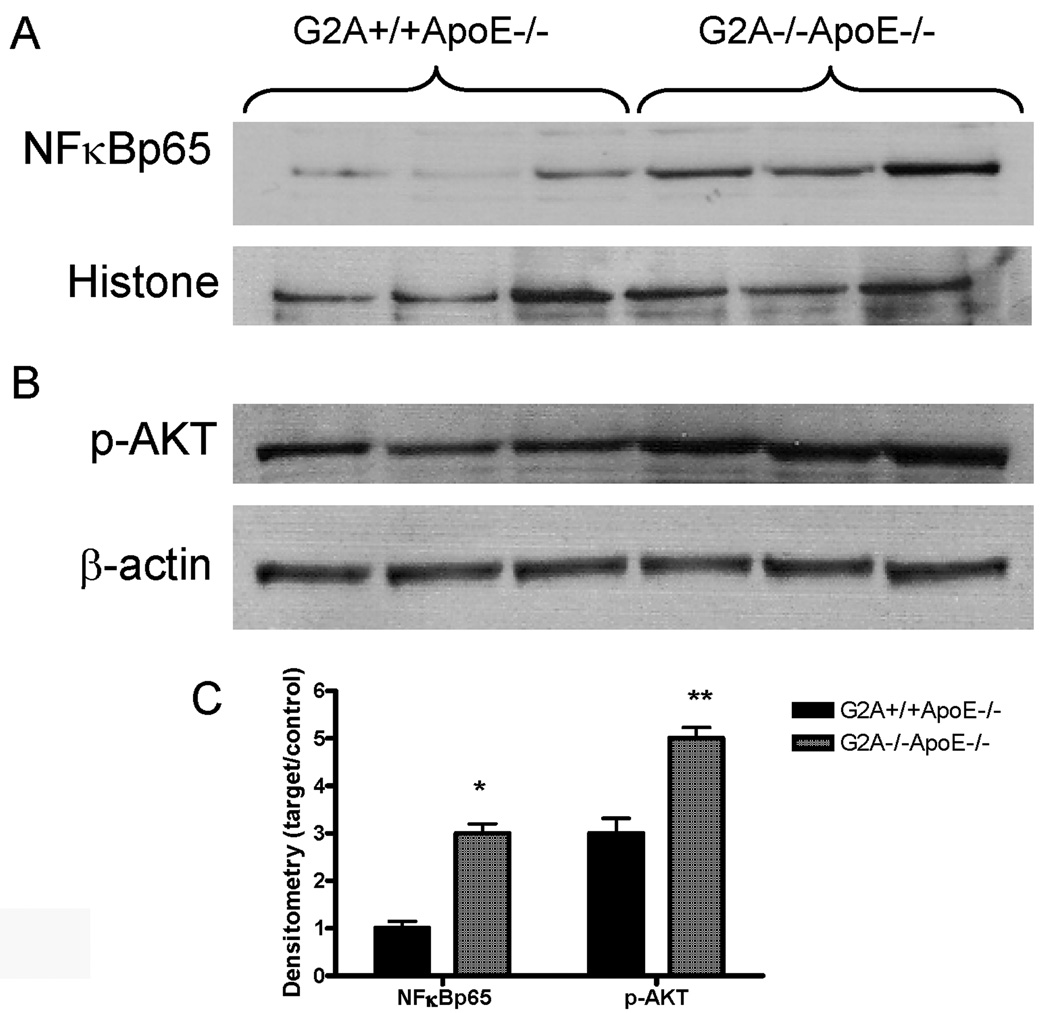
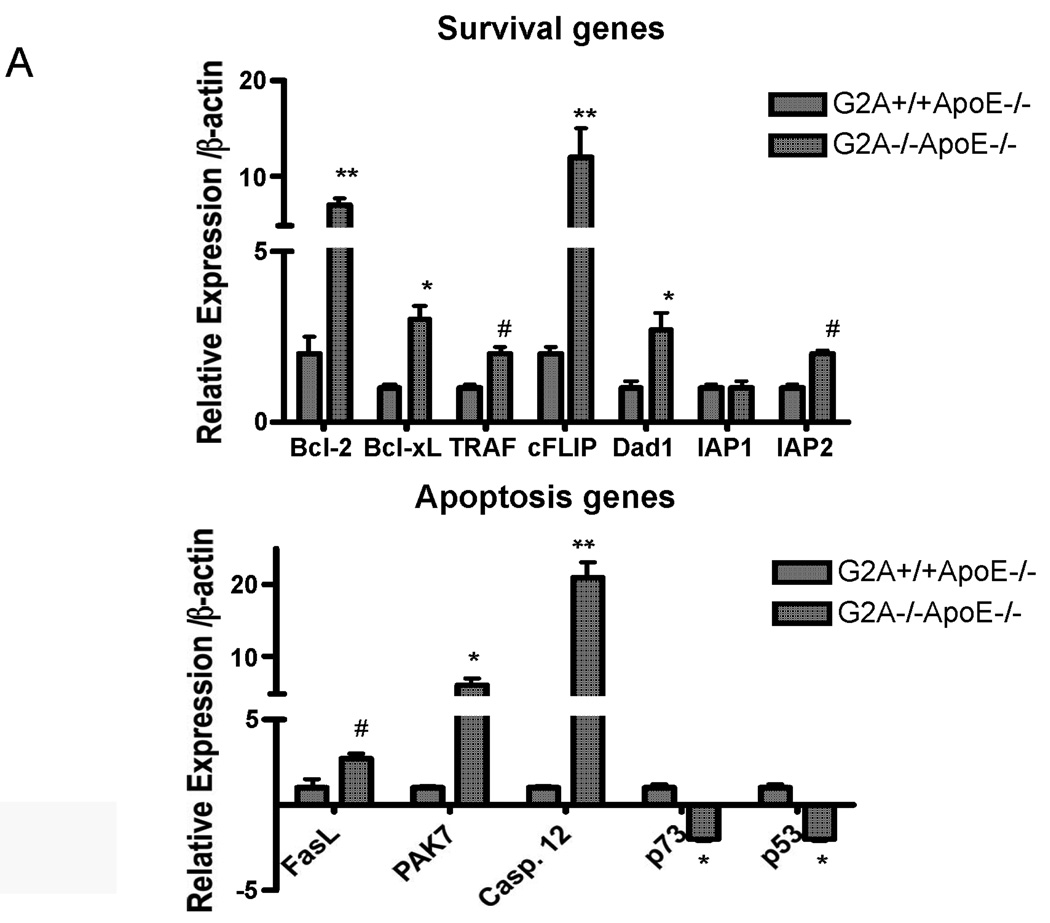
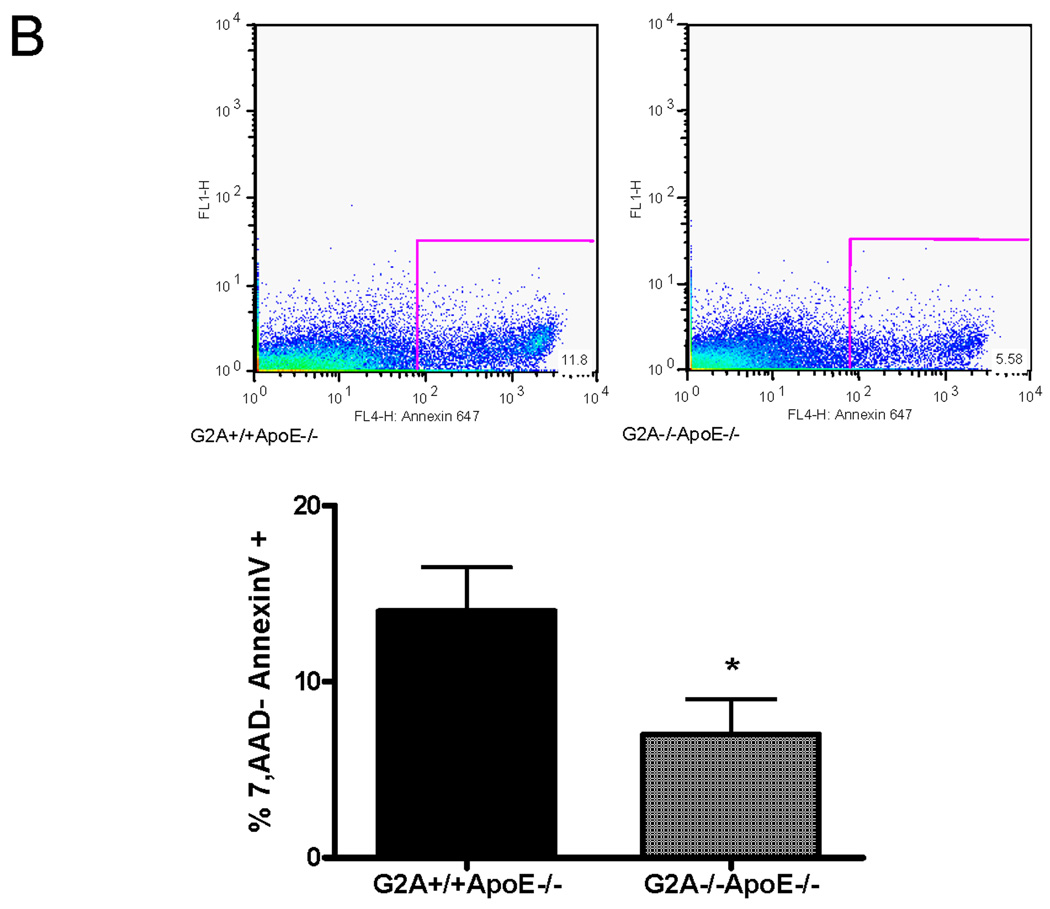
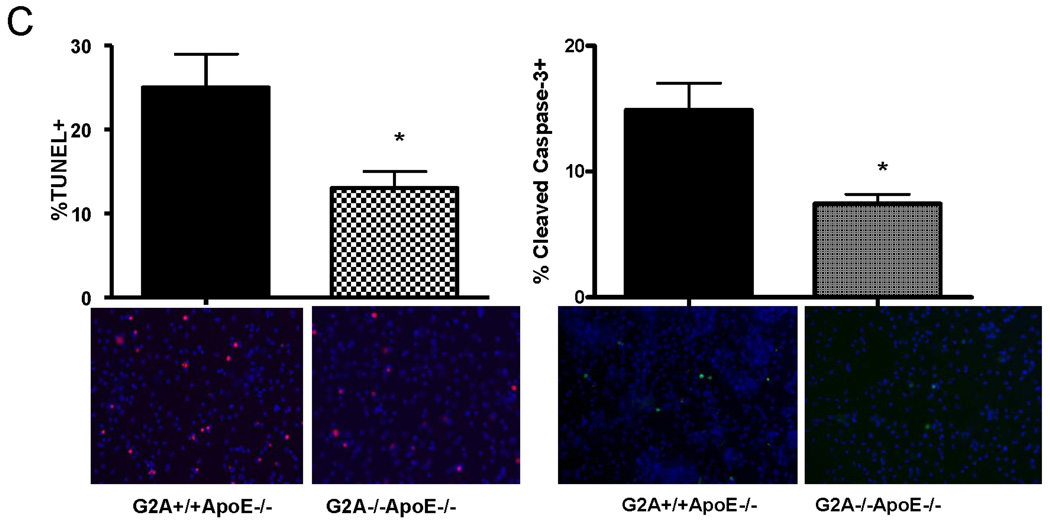
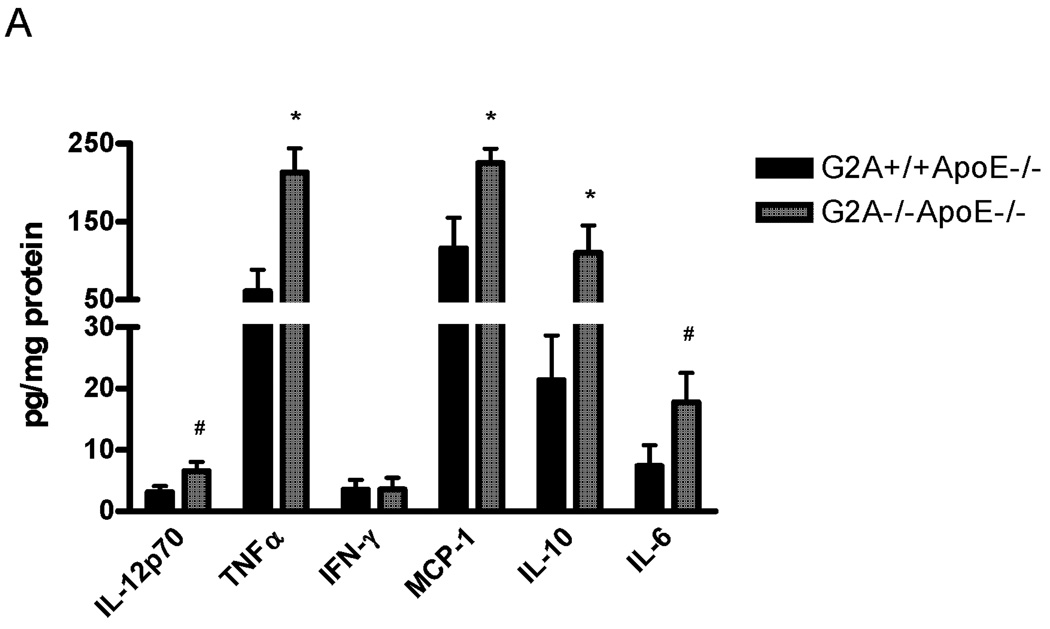
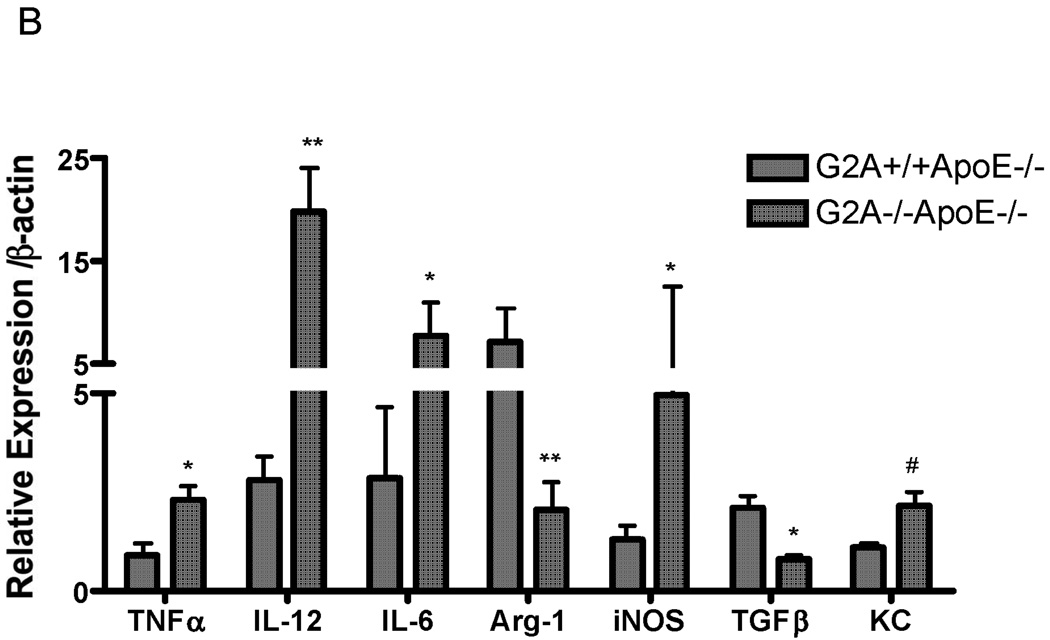
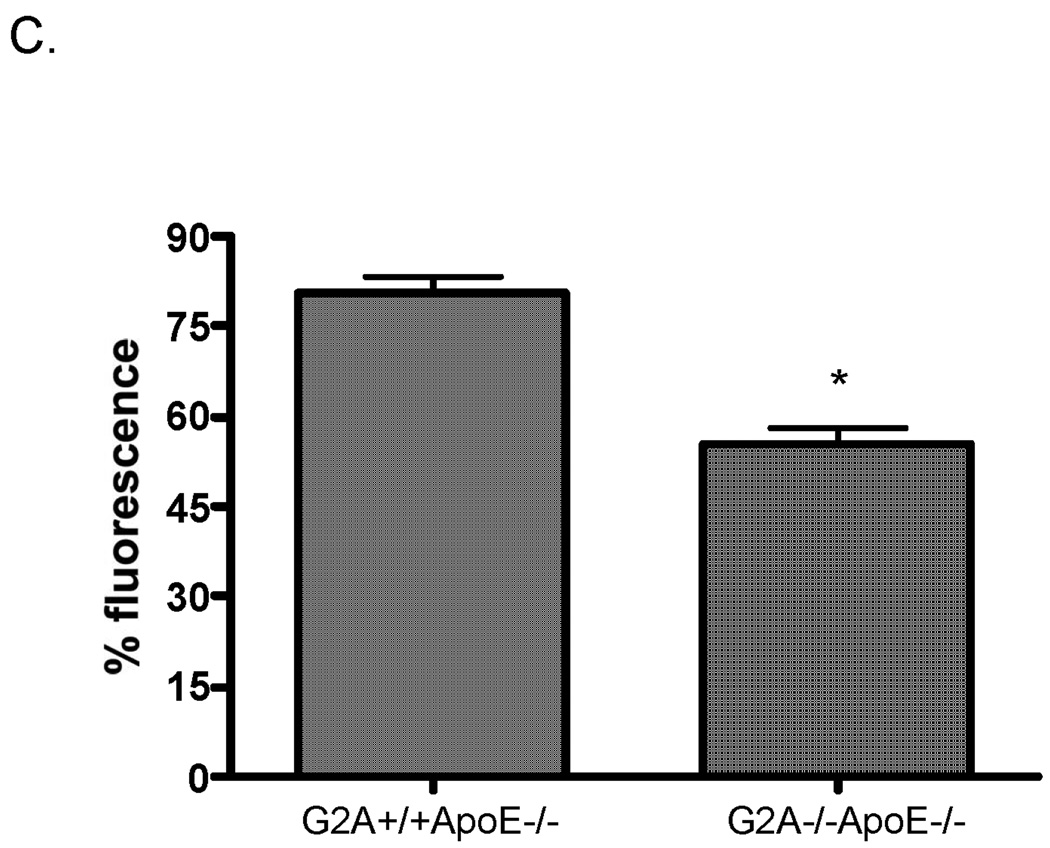
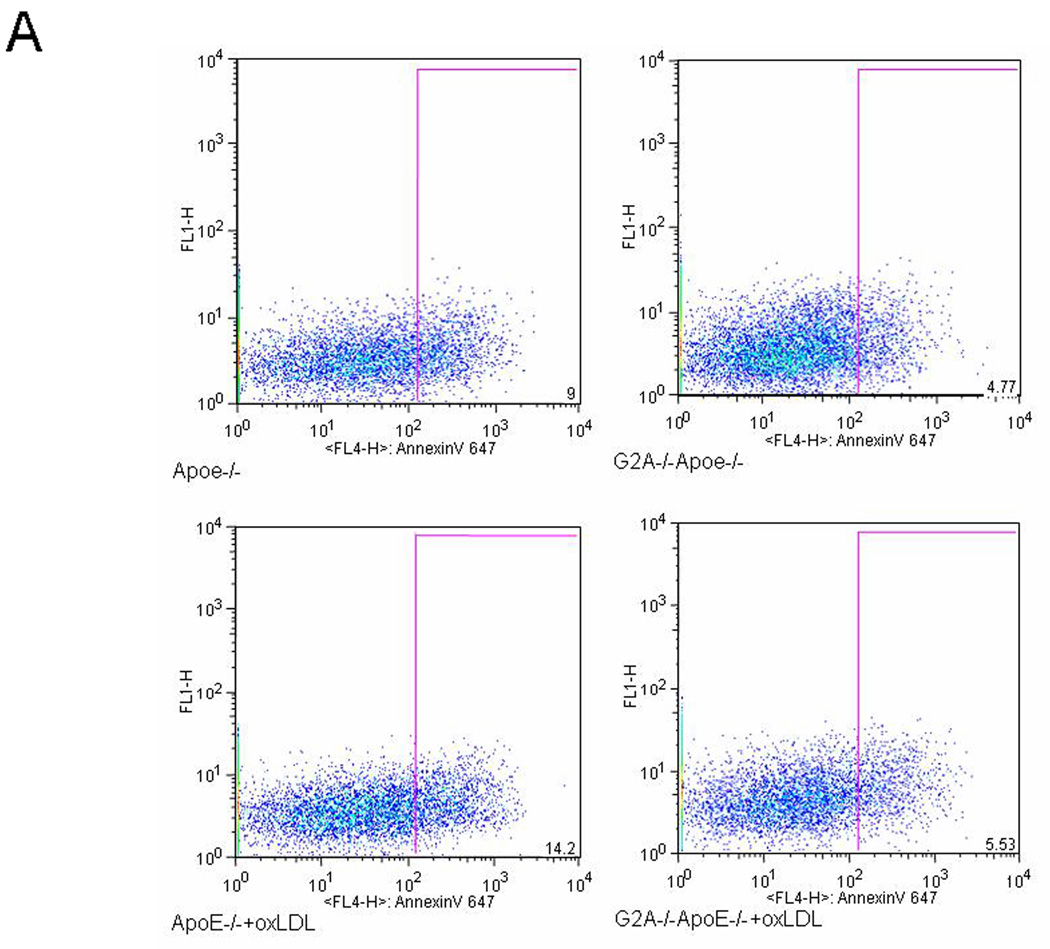
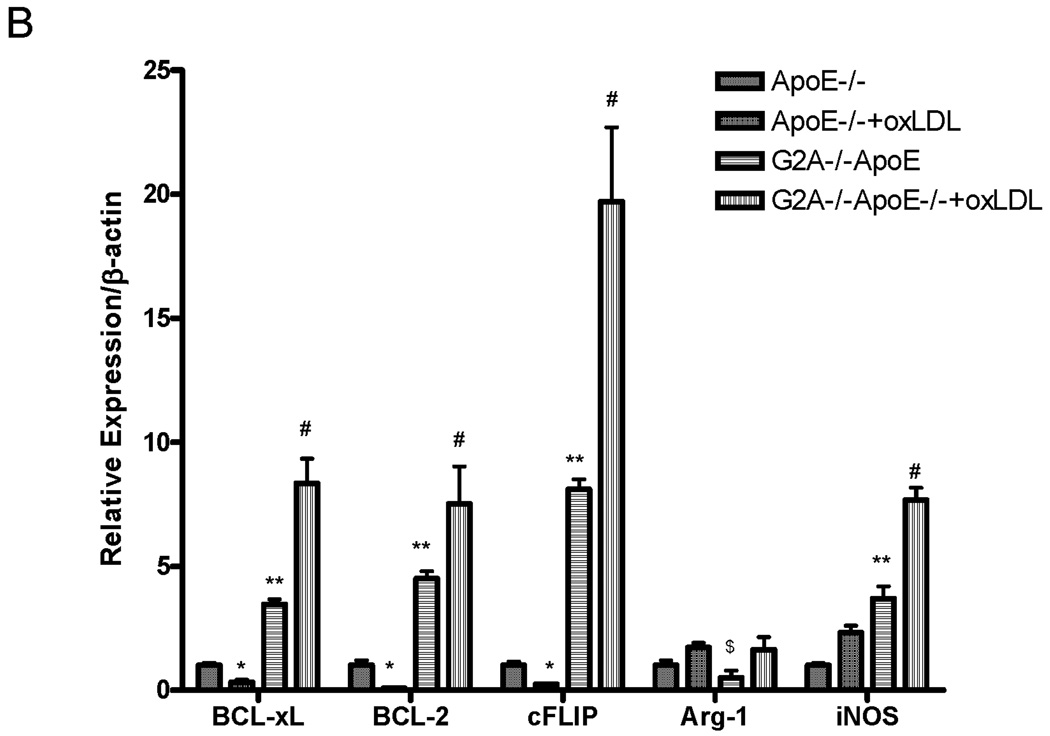
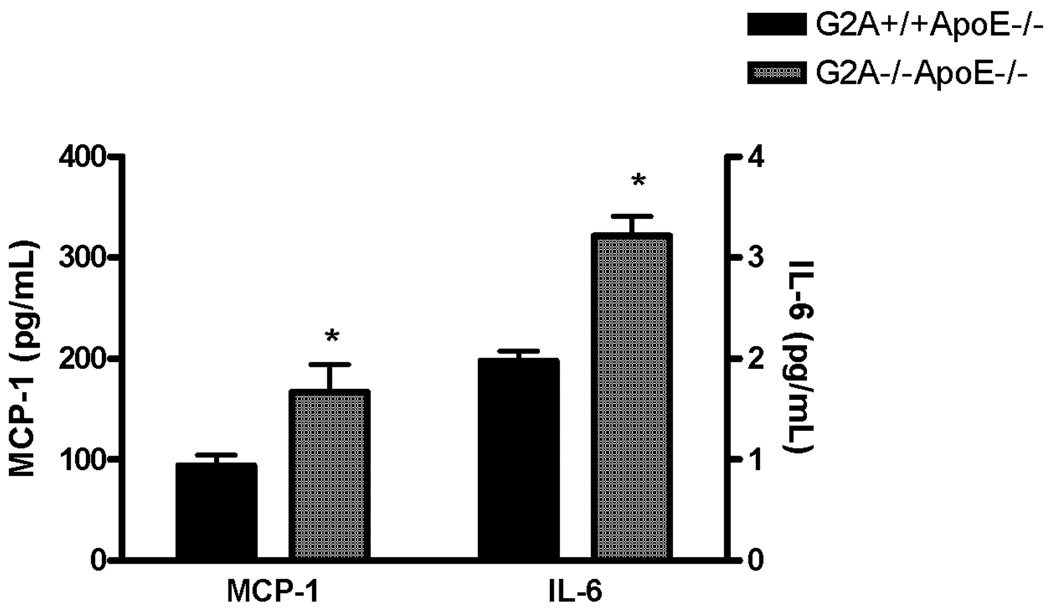
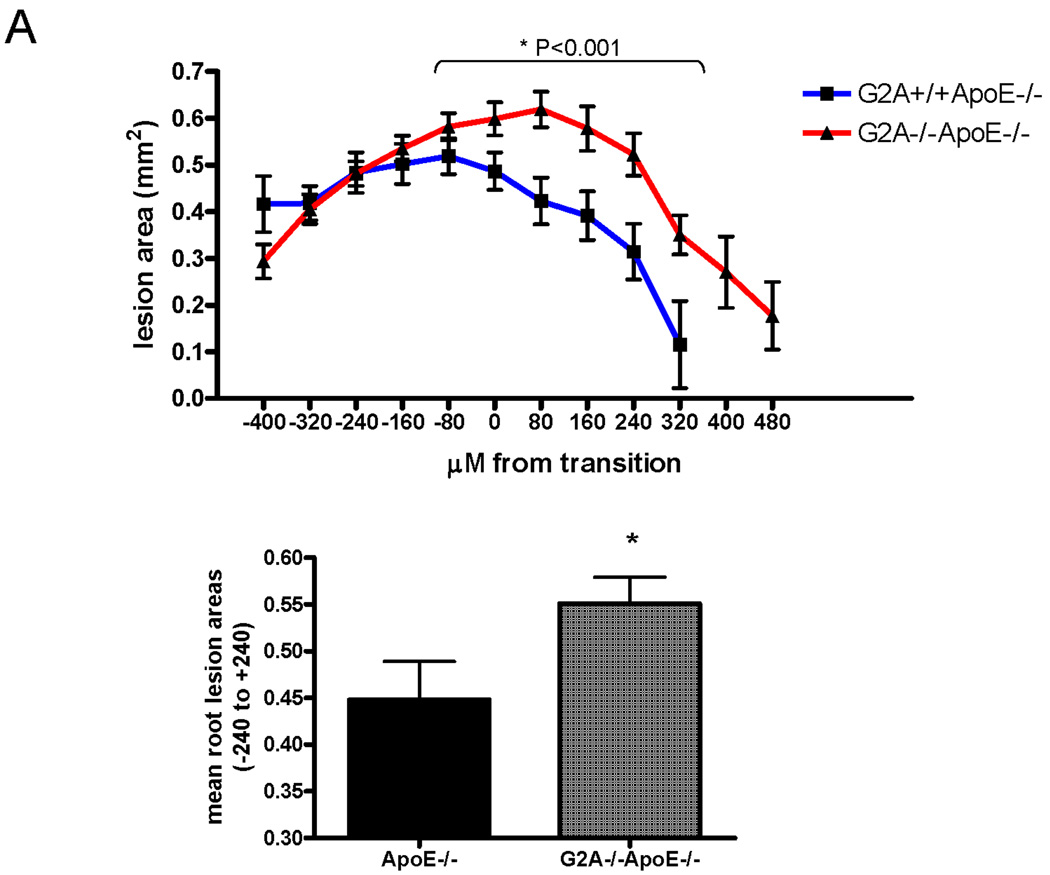
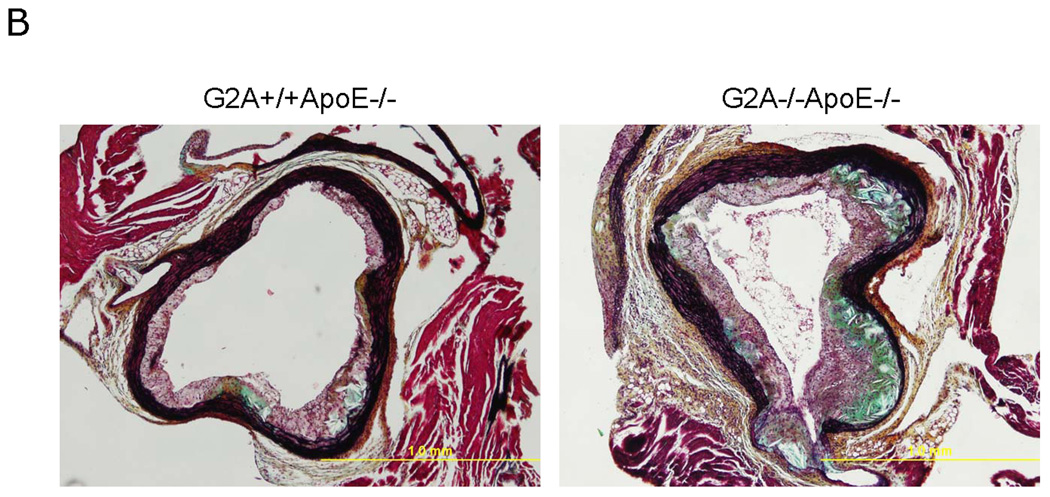
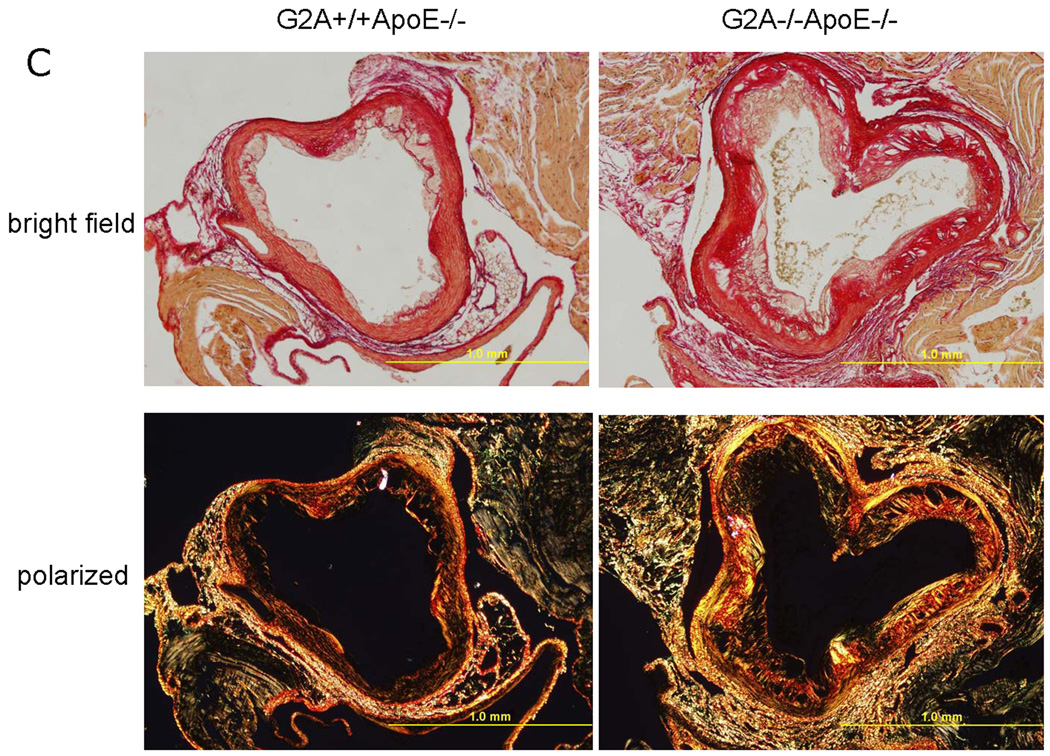
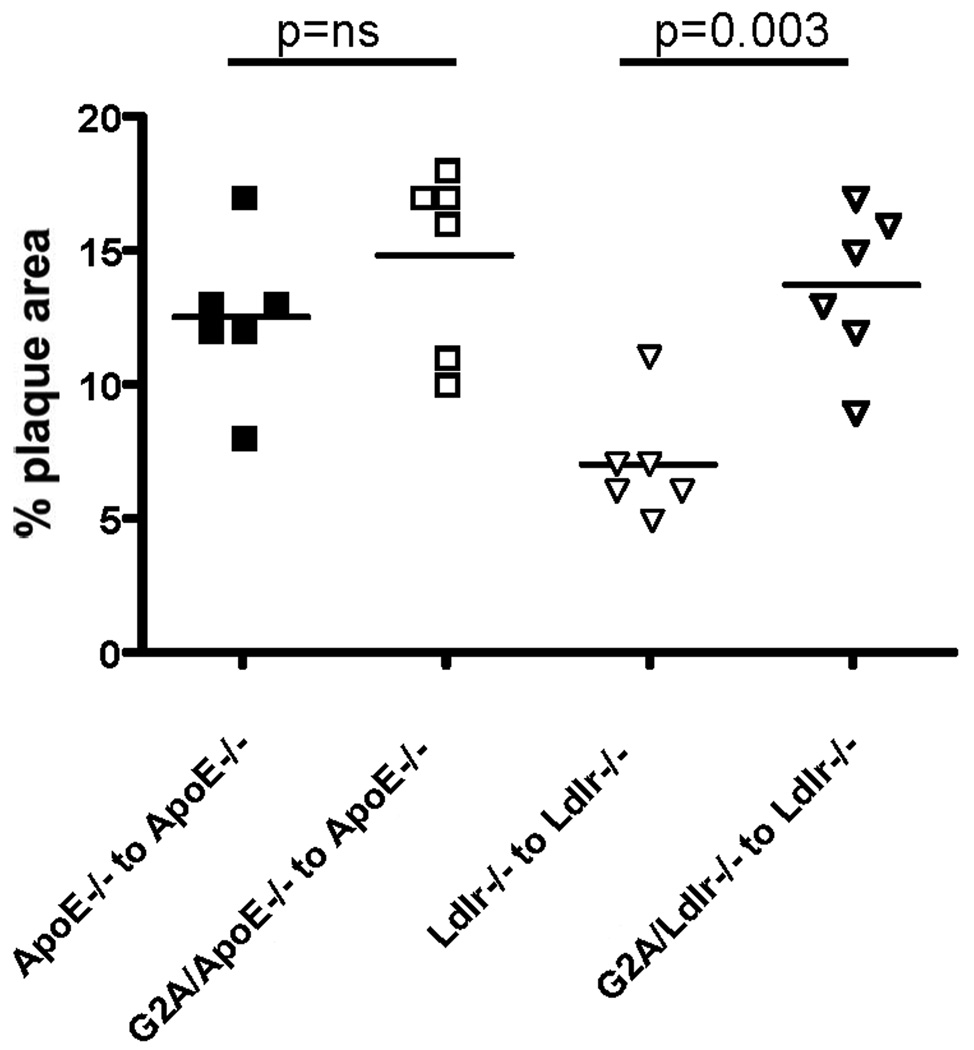
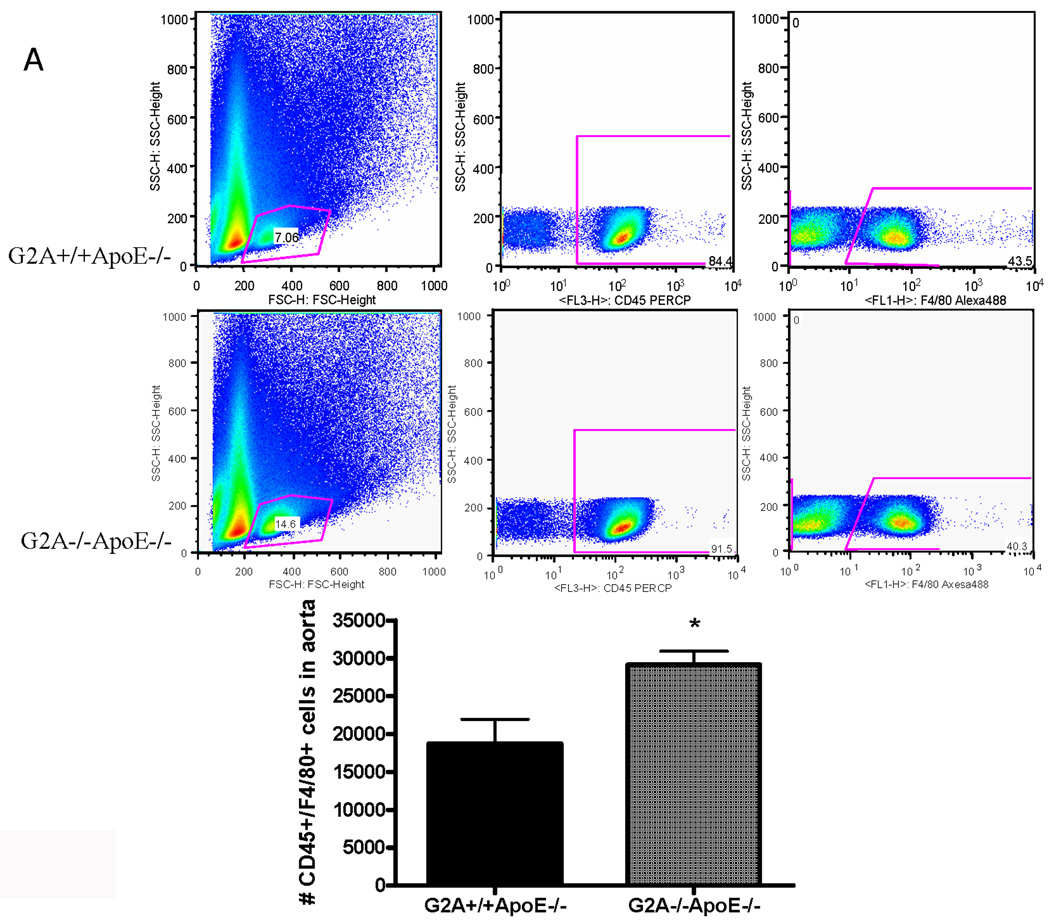
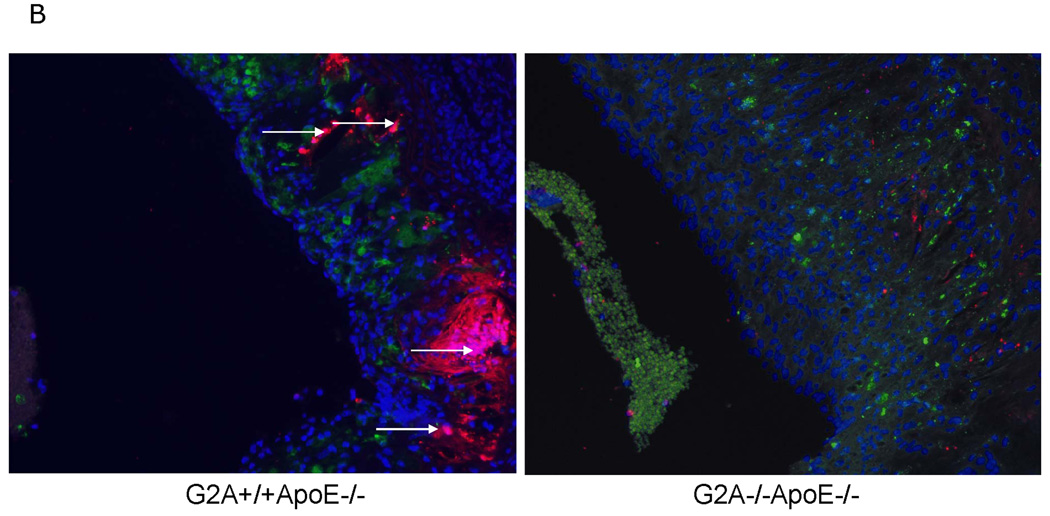
G2A is a stress-inducible G protein-coupled receptor that is expressed on several cell types within atherosclerotic lesions. We demonstrated previously that G2A deficiency in mice increased aortic monocyte recruitment and increased monocyte:endothelial interactions. To investigate the impact of G2A deficiency in macrophages, we isolated peritoneal macrophages from G2A(+/+)ApoE(-/-) and G2A(-/-)ApoE(-/-) mice. G2A(-/-)ApoE(-/-) macrophages had significantly lower apoptosis than control macrophages. The prosurvival genes BCL-2, BCL-xL, and cFLIP were increased in G2A(-/-)ApoE(-/-) macrophages. Macrophages from G2A(-/-)ApoE(-/-) mice also had increased proinflammatory status that was indicative of a M1 macrophage phenotype. This was indicated by significantly increased nuclear translocation of nuclear factor kappaB, as well as production of interleukin-12p40, tumor necrosis factor alpha, and interleukin-6, and reduced expression of arginase-I. Moreover, G2A(-/-)ApoE(-/-) macrophages had reduced ability to engulf apoptotic cells in vitro. We examined atherosclerosis in mice fed a Western diet for 10 weeks and found that G2A deficiency increased lesion size in the aortic root by 50%. Plasma lipid levels were not changed in G2A(-/-)ApoE(-/-) mice. However, we found that absence of G2A increased the number of aortic macrophages and attenuated apoptosis in this cell type. Moreover, bone marrow transplantation studies indicated that deficiency of G2A in marrow-derived cells significantly contributed to atherosclerosis development. In the absence of G2A, increased macrophage activation and decreased apoptosis is associated with accumulation of macrophages in the aorta and increased atherosclerosis.


Figures

Figure 1
Figure 1. NFκB is activated in G2A−/− macrophages
Cytosol and nuclear extracts were isolated as described in Methods from G2A+/+ApoE−/− and G2A−/−ApoE−/− mice fed a Western diet for 10 weeks. Images shown are peritoneal macrophages isolated from three mice from each group. Panel A. 50µg of nuclear proteins were analyzed by SDS-PAGE for NFκBp65 or histone. Panel B. 50µg of cytosolic proteins were used to analyze levels of phosphorylated AKT and β-actin. Panel C. Graph represents densitometry of 6 mice per group. *Significantly greater than G2A+/+ApoE−/− control, P<0.002, **significantly greater than control, P<0.005.
Figure 2
Figure 2. Increased survival gene expression and reduced apoptosis of macrophages in G2A−/− mice
Panel A. Gene expression. Pro-survival and pro-apoptotic gene expression in peritoneal macrophages isolated from G2A+/+ApoE−/− and G2A−/−ApoE−/− mice fed a Western diet for 10 weeks was analyzed by quantitative real-time RT-PCR. *p<0.005, **p<0.0001, #p<0.01 between G2A+/+ApoE−/− and G2A−/−ApoE−/−. Panel B. Measurements of macrophage apoptosis. Peritoneal macrophages were isolated as described in Methods from ten each of G2A+/+ApoE−/− and G2A−/−ApoE−/− mice fed a Western diet for 10 weeks. Macrophages were stained for AnnexinV-Alexa647 using the Vybrant Apoptosis assay kit (Molecular Probes) according to the manufacturer’s instructions. Data was analyzed using FlowJo software. Representative dot plots are shown for each group, and the mean percentage of 7,AAD-AnnexinV+ cells per group was plotted. *Significantly less than G2A+/+ApoE−/− control, P<0.0001. Panel C. TUNEL and caspase-3 staining. Peritoneal macrophages from each group were stained for TUNEL using the TMR red in situ TUNEL assay kit (Roche Applied Sciences) or stained for cleaved Caspase-3 as described in Methods. Nuclei were stained with DAPI (blue). *Significantly less than G2A+/+ApoE−/− control for TUNEL, p<0.0005; *Significantly less than G2A+/+ApoE−/− control for cleaved caspase-3, p<0.002.
Figure 3
Figure 3. Inflammatory cytokine production by G2A−/− macrophages
Panel A. Cytometric bead arrays were used to analyze inflammatory cytokine secretion from G2A+/+ApoE−/− and G2A−/−ApoE−/− peritoneal macrophages fed a Western diet for 10 weeks. Assays were conducted according to the manufacturer’s instructions. #Significantly greater than G2A+/+ApoE−/− control, P<0.02, *significantly greater than G2A+/+ApoE−/− control, P<0.005. Panel B. Quantitative real-time RT-PCR of macrophage inflammatory markers represented as relative expression and normalized to β-actin. *p<0.001, **p<0.0001, #p<0.008. Panel C. Peritoneal macrophages from G2A+/+ApoE−/− and G2A−/−ApoE−/− mice fed a Western diet for 10 weeks were incubated with fluorescently-labeled apoptotic Jurkat cells for 15 minutes for an engulfment assay. The percentage of engulfed cells was determined as a measure of fluorescence by flow cytometry. *p<0.03, Data represent an ‘n’ of 4 mice per group.
Figure 4
Figure 4. Oxidized LDL treatment of peritoneal macrophages
Panel A. Peritoneal macrophages were isolated from 6 mice per group fed chow, treated +/− oxLDL (50µg/mL) for 18 hours and stained for AnnexinV-Alexa647 using the Vybrant Apoptosis assay kit (Molecular Probes) according to the manufacturer’s instructions. Data was analyzed using FlowJo software. Representative dot plots are shown for each group. Panel B. Quantitative real-time RT-PCR of anti-apoptosis genes and macrophage inflammatory markers represented as relative expression and normalized to β-actin. * Significantly lower than G2A+/+ApoE−/− control, P<0.005, **greater than G2A+/+ApoE−/− control, P<0.001, # greater than G2A−/−ApoE−/−, P<0.002, $ less than G2A+/+ApoE−/− control, P<0.02.
Figure 5
Figure 5. Plasma cytokine concentrations
Blood was collected from 15 each of G2A+/+ApoE−/− and G2A−/−ApoE−/− mice after 10 weeks on Western diet via cardiac puncture. Plasma was analyzed for cytokine production using a cytometric bead array and flow cytometry. *Significantly higher than G2A+/+ApoE−/− control, P<0.002.
Figure 6
Figure 6. G2A−/−ApoE−/− mice have increased atherosclerosis after 10 weeks of diet feeding
Panel A. Atherosclerotic lesion analysis. Aortic roots from G2A+/+ApoE−/− and G2A−/−ApoE−/− mice were embedded in paraffin. 5µM sequential sections from the aortic sinus and the descending aorta (−400µM to +480µM from the transition) were sectioned and stained using oil red O, and lesion area was quantified using Image Pro software analysis. *Significantly greater lesion area than G2A+/+ApoE−/− control (from −240µM to +240µM, P<0.001). Panel B. Movat staining of aortic root sections. 5µM sections from the aortic sinus and the descending aorta at +160µM were stained using pentachrome MOVAT stain. Collagen and reticulum fibers - yellow to greenish yellow. Panel C. Picrosirius red staining of aortic root sections. 5µM sections at +160µM from the transition were stained using picrosirius red stain and visualized under bright field and polarized light. Under normal light, collagen content of the lesion is visible by red staining. Under polarized light, red, orange, yellow, and green colors are apparent (the colors of collagen fibers in order of decreasing thickness) .
Figure 7
Figure 7. Absence of G2A in marrow-derived cells contributes to atherosclerosis
Female LDLR−/− or apoE−/− mice were irradiated and transplanted with donor bone marrow (Ldlr−/−, G2A−/−Ldlr−/−, apoE−/−, G2A−/−ApoE−/−) as indicated in the figure. Mice were reconstituted for 6 weeks, after which they were fed a Western diet for 10 weeks. Atherosclerosis was assessed by measuring en face aortic lesion area.
Figure 8
Figure 8. Increased numbers of macrophages in the aortic wall of G2A−/−ApoE−/− mice
Panel A. Whole aorta flow cytometry for macrophage content. Aortas were isolated from ten each of G2A+/+ApoE−/− and G2A−/−ApoE−/− mice after 10 weeks on Western diet. Aortas were digested and analyzed for leukocyte content by flow cytometry as described in Methods. Data was analyzed using FlowJo software and the total number of CD45+F4/80+ cells/aorta was plotted. *Significantly greater than G2A+/+ApoE−/− control, P<0.005. Panel B. Fluorescent imaging of lesional macrophage apoptosis. 5µM aortic root sections at +160µM from the transition were stained for resident macrophages and apoptosis. Green: MAC-2; Red: TUNEL; Blue: DAPI nuclear stain. G2A−/−ApoE−/− aortic root sections showed increased individual macrophage staining and decreased TUNEL. G2A+/+ApoE−/− sections showed increased MAC-2/TUNEL colocalization to nuclear intact cells as indicated by the arrows (pink color).

Similar articles

Cited by

References

    1. Witztum JL, Steinberg D. Role of oxidized low density lipoprotein in atherogenesis. J Clin Invest. 1991;88:1785–1792. - PMC - PubMed
    1. Springer TA. Traffic signals on endothelium for lymphocyte recirculation and leukocyte emigration. Annu Rev Physiol. 1995;57:827–872. - PubMed
    1. Cybulsky MI, Lichtman AH, Hajra L, Iiyama K. Leukocyte adhesion molecules in atherogenesis. Clin Chim Acta. 1999;286:207–218. - PubMed
    1. Berliner JA, Vora DK, Shih PT. Control of leukocyte adhesion and activation in atherogenesis. In: Pearson J, editor. Vascular Adhesion and Inflammation. Basel, Switzerland: Birkhauser Verlag; 2001.
    1. Berliner JA, Navab M, Fogelman AM, Frank JS, Demer LL, Edwards PA, Watson AD, Lusis AJ. Atherosclerosis: basic mechanisms. Oxidation, inflammation, and genetics. Circulation. 1995;91:2488–2496. - PubMed

Publication types

MeSH terms