

Human and mouse switch-like genes share common transcriptional regulatory mechanisms for bimodality
- PMID: 19105848
- PMCID: PMC2631022
- DOI: 10.1186/1471-2164-9-628
Human and mouse switch-like genes share common transcriptional regulatory mechanisms for bimodality
Abstract
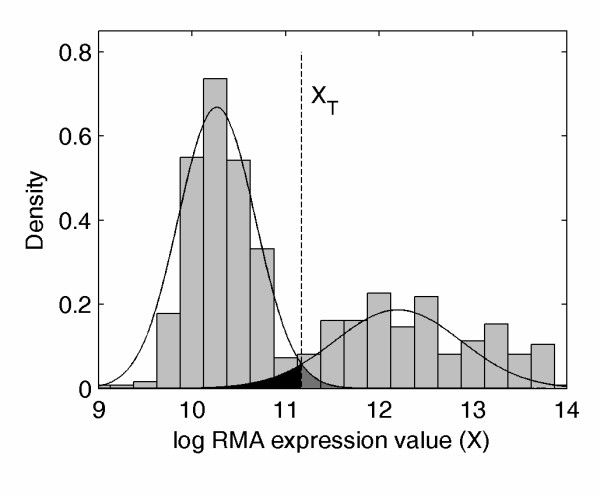
Background: Gene expression is controlled over a wide range at the transcript level through complex interplay between DNA and regulatory proteins, resulting in profiles of gene expression that can be represented as normal, graded, and bimodal (switch-like) distributions. We have previously performed genome-scale identification and annotation of genes with switch-like expression at the transcript level in mouse, using large microarray datasets for healthy tissue, in order to study the cellular pathways and regulatory mechanisms involving this class of genes. We showed that a large population of bimodal mouse genes encoding for cell membrane and extracellular matrix proteins is involved in communication pathways. This study expands on previous results by annotating human bimodal genes, investigating their correspondence to bimodality in mouse orthologs and exploring possible regulatory mechanisms that contribute to bimodality in gene expression in human and mouse.
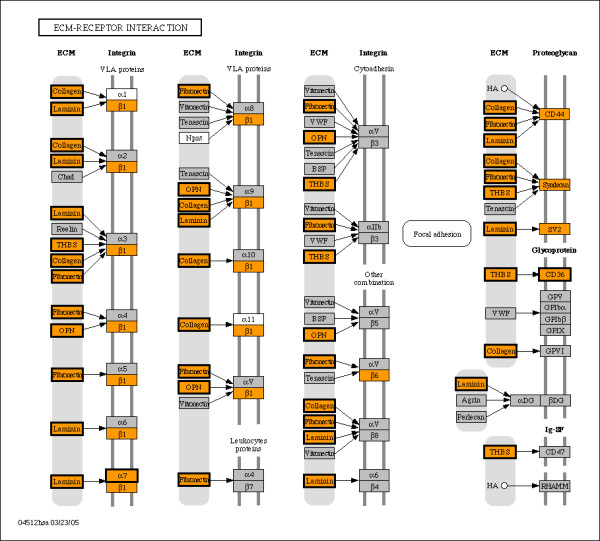
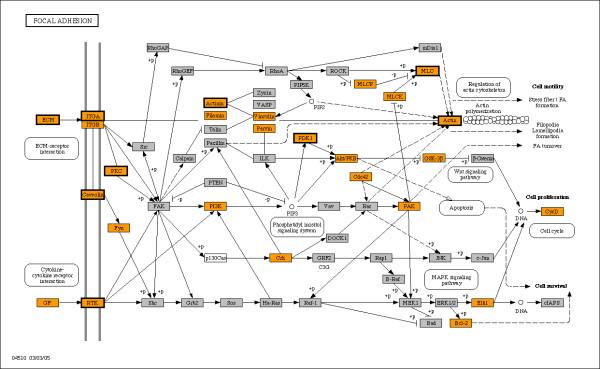
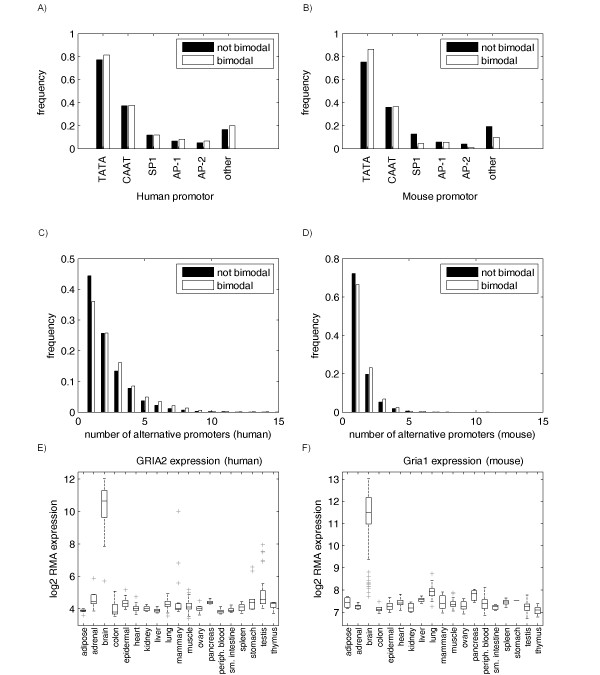
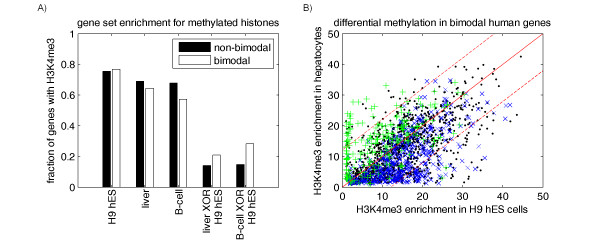
Results: Fourteen percent of the human genes on the HGU133A array (1847 out of 13076) were identified as bimodal or switch-like. More than 40% were found to have bimodal mouse orthologs. KEGG pathways enriched for bimodal genes included ECM-receptor interaction, focal adhesion, and tight junction, showing strong similarity to the results obtained in mouse. Tissue-specific modes of expression of bimodal genes among brain, heart, and skeletal muscle were common between human and mouse. Promoter analysis revealed a higher than average number of transcription start sites per gene within the set of bimodal genes. Moreover, the bimodal gene set had differentially methylated histones compared to the set of the remaining genes in the genome.
Conclusion: The fact that bimodal genes were enriched within the cell membrane and extracellular environment make these genes as candidates for biomarkers for tissue specificity. The commonality of the important roles bimodal genes play in tissue differentiation in both the human and mouse indicates the potential value of mouse data in providing context for human tissue studies. The regulation motifs enriched in the bimodal gene set (TATA boxes, alternative promoters, methlyation) have known associations with complex diseases, such as cancer, providing further potential for the use of bimodal genes in studying the molecular basis of disease.
Figures
Similar articles
-
Switch-like genes populate cell communication pathways and are enriched for extracellular proteins.BMC Genomics. 2008 Jan 4;9:3. doi: 10.1186/1471-2164-9-3. BMC Genomics. 2008. PMID: 18177501 Free PMC article.
-
Expression profiles of switch-like genes accurately classify tissue and infectious disease phenotypes in model-based classification.BMC Bioinformatics. 2008 Nov 17;9:486. doi: 10.1186/1471-2105-9-486. BMC Bioinformatics. 2008. PMID: 19014681 Free PMC article.
-
Genome-wide profiling of DNA methylation reveals a class of normally methylated CpG island promoters.PLoS Genet. 2007 Oct;3(10):2023-36. doi: 10.1371/journal.pgen.0030181. Epub 2007 Sep 10. PLoS Genet. 2007. PMID: 17967063 Free PMC article.
-
Genome-wide DNA methylation analysis reveals molecular subtypes of pancreatic cancer.Oncotarget. 2017 Apr 25;8(17):28990-29012. doi: 10.18632/oncotarget.15993. Oncotarget. 2017. PMID: 28423671 Free PMC article.
-
The human CYP19 (aromatase P450) gene: update on physiologic roles and genomic organization of promoters.J Steroid Biochem Mol Biol. 2003 Sep;86(3-5):219-24. doi: 10.1016/s0960-0760(03)00359-5. J Steroid Biochem Mol Biol. 2003. PMID: 14623514 Review.
Cited by
-
RB-pathway disruption in breast cancer: differential association with disease subtypes, disease-specific prognosis and therapeutic response.Cell Cycle. 2010 Oct 15;9(20):4153-63. doi: 10.4161/cc.9.20.13454. Epub 2010 Oct 27. Cell Cycle. 2010. PMID: 20948315 Free PMC article.
-
Species differential regulation of COX2 can be described by an NFκB-dependent logic AND gate.Cell Mol Life Sci. 2015 Jun;72(12):2431-43. doi: 10.1007/s00018-015-1850-1. Epub 2015 Feb 20. Cell Mol Life Sci. 2015. PMID: 25697863 Free PMC article.
-
Analysis of the CYP1A1 mRNA dose-response in human keratinocytes indicates that relative potencies of dioxins, furans, and PCBs are species and congener specific.Toxicol Sci. 2010 Dec;118(2):704-15. doi: 10.1093/toxsci/kfq262. Epub 2010 Sep 6. Toxicol Sci. 2010. PMID: 20819910 Free PMC article.
-
Classification of genes and putative biomarker identification using distribution metrics on expression profiles.PLoS One. 2010 Feb 4;5(2):e9056. doi: 10.1371/journal.pone.0009056. PLoS One. 2010. PMID: 20140228 Free PMC article.
-
Bimodal distribution of RNA expression levels in human skeletal muscle tissue.BMC Genomics. 2011 Feb 7;12:98. doi: 10.1186/1471-2164-12-98. BMC Genomics. 2011. PMID: 21299892 Free PMC article.
References
-
- Ashburner M, Ball CA, Blake JA, Botstein D, Butler H, Cherry JM, Davis AP, Dolinski K, Dwight SS, Eppig JT, Harris MA, Hill DP, Issel-Tarver L, Kasarskis A, Lewis S, Matese JC, Richardson JE, Ringwald M, Rubin GM, Sherlock G. Gene Ontology: tool for the unification of biology. Nat Genet. 2000;25:25–29. doi: 10.1038/75556. - DOI - PMC - PubMed
Publication types
MeSH terms
Substances
Grants and funding
LinkOut - more resources
Full Text Sources
