. 2009 May;16(5):439-52.
doi: 10.1038/cgt.2008.96. Epub 2008 Dec 19.

Retrovirally transduced murine T lymphocytes expressing FasL mediate effective killing of prostate cancer cells

Affiliations

Retrovirally transduced murine T lymphocytes expressing FasL mediate effective killing of prostate cancer cells

J C Symes et al. Cancer Gene Ther. 2009 May.

Abstract

Adoptively transferred T cells possess anticancer activities partially mediated by T-cell FasL engagement of Fas tumor targets. However, antigen-induced T-cell activation and clonal expansion, which stimulates FasL activity, is often inefficient in tumors. As a gene therapy approach to overcome this obstacle, we have created oncoretroviral vectors to overexpress FasL or non-cleavable FasL (ncFasL) on murine T cells of a diverse T-cell receptor repertoire. Expression of c-FLIP was also engineered to prevent apoptosis of transduced cells. Retroviral transduction of murine T lymphocytes has historically been problematic, and we describe optimized T-cell transduction protocols involving CD3/CD28 co-stimulation of T cells, transduction on ice using concentrated oncoretrovirus, and culture with IL-15. Genetically modified T cells home to established prostate cancer tumors in vivo. Co-stimulated T cells expressing FasL, ncFasL and ncFasL/c-FLIP each mediated cytotoxicity in vitro against RM-1 and LNCaP prostate cancer cells. To evaluate the compatibility of this approach with current prostate cancer therapies, we exposed RM-1, LNCaP, and TRAMP-C1 cells to radiation, mitoxantrone, or docetaxel. Fas and H-2(b) expression were upregulated by these methods. We have developed a novel FasL-based immuno-gene therapy for prostate cancer that warrants further investigation given the apparent constitutive and inducible Fas pathway expression in this malignancy.


Figures

Figure 1
Figure 1
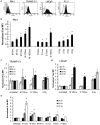
Optimization of T-cell transduction. T cells were transduced with E86-ncFasL virus under various conditions and transduction efficiency determined. (a) Representative plots showing ncFasL-expression on T cells following transduction with oncoretroviral supernatant in the presence of protamine sulfate with: no additional manipulation; transduction performed on fibronectin-coated plates; transduction by spinoculation at 1000 g for 1 h, 32 °C; or by co-culture with E86 ncFasL virus-producing cells for 3 days. With the exception of co-culture transduced cells, T cells were transduced two times. Filled histograms represent anti-FasL-labeled cells, outline histograms represent matched isotype control staining. (b) Representative flow cytometry plots showing FasL expression on non-transduced (NT) T cells or T cells following one round of transduction with: unmanipulated retroviral supernatant; concentrated retroviral supernatant; or concentrated retroviral supernatant with a 3 h incubation on ice. In parts (a) and (b), T cells were stimulated with anti-CD3/CD28 beads. (c) Effect of the T-cell stimulation method on transduction efficiency. T cells were stimulated for 48 h with 5 μg ml−1 ConA, 2.5 μg ml−1 PHA, or anti-CD3/CD28 beads at an initial bead-to-cell ratio of 3:1, and subjected to retroviral transduction with concentrated supernatant and incubation on ice. Transgene expression levels are shown on day 3 post-transduction for E86-eGFP, E86-FasL, E86-ncFasL and E86-ncFasL/c-FLIP transduced T cells, as determined by flow cytometry.
Figure 2
Figure 2
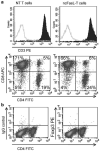
Phenotype of non-transduced (NT) and ncFasL T cells. (a) Expression of CD3, CD4 and CD8 was assessed on T cells following 4 days in culture (3 days after transduction). Filled histograms represent anti-CD3-labeled cells, outline histograms represent matched isotype control-labeled cells. (b) Non-transduced T cells were co-labeled with anti-CD4 and anti-Foxp3 antibodies to detect regulatory T cells. Similar results were obtained when ncFasL-T cells were analyzed.
Figure 3
Figure 3
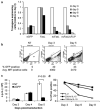
Reduction of T-cell transgene expression over time in culture is slowed by IL-15. (a) Transgene expression on T cells stimulated with anti-CD3/CD28 beads and transduced with oncoretroviruses is shown relative to expression levels at day 3, as measured by flow cytometry. Data are representative of two independent experiments. (b) Where the percentage of eGFP-expressing T cells remains stable by day 3 post-transduction, the MFI of transduced cells is decreased with time. MFI is measured by flow cytometry and is calculated on events falling in the gated area R4. (c) Transduced cells have a reduced proliferative capacity compared with non-transduced control cells over time, as measured by 3H-thymidine incorporation assays. Cells (105) were plated per well on day 3 and growth rates were assessed on day 3, day 4, and day 5 post-transduction. Transduced cells were 46% eGFP positive on day 3. Data are representative of two experiments, each with n = 3. (d) When ncFasL T cells are cultured with IL-15 rather than IL-2, loss of ncFasL transgene expression is slowed.
Figure 4
Figure 4
Ex vivo manipulated T cells reach tumor sites in vivo. Splenic T cells were transduced with E86-eGFP virus and labeled with CFSE to aid in visualization. After 4 days in culture, 107 cells were injected i.v.(n = 6) or s.c. into the tumor area (n = 3) of C57Bl/6 mice bearing 6 days established RM-1 tumors. T cells were also injected i.v. into non-tumor-bearing mice as a control (n = 2). The percentage of cells that co-labeled with anti-CD3 and CFSE in each organ at 16 or 40 h after T-cell injection are shown. All s.c.-injected mice were analyzed at 40 h; i.v.-injected and control mice were split into two equal groups for analysis at 16 and 40 h. The number of manipulated T cells is presented as the percentage of CD3+ cells in the lung, lymph node, spleen and tumor that were also CFSE+, as measured by flow cytometry and based on 105 events.
Figure 5
Figure 5
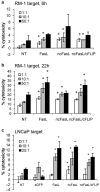
RM-1 cells can be killed by FasL-overexpressing T cells. RM-1 cells undergo significant cytotoxicity following (a) 6 h or (b) 22 h co-incubation with FasL, ncFasL, or ncFasL/c-FLIP-expressing T cells, compared with non-transduced (NT) control T cells. (c) LNCaP cells are killed in a dose-dependent manner when co-incubated with FasL-expressing T cells in a similar 6 h cytotoxicity assay. In this assay, T cells were cultured in the presence of 20 μm Z-VAD-FMK. *P < 0.05 compared with NT control cell killing at same ratio.
Figure 6
Figure 6
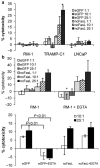
Prostate cancer cell killing is T-cell-mediated but independent of exocytosis pathways. (a) 51Cr-release assays were repeated using clonal K562 cells expressing either ncFasL or control eGFP as effector cells and RM-1, TRAMP-c1 and LNCaP tumor cell targets at the effector/target cell ratios indicated. Data is representative of two independent experiments; n = 3 for all points. (b) Cytotoxicity assays were repeated in the presence of 3 mm MgCl2 and 4 mm EGTA to inhibit cytolysis through exocytosis pathways. The assay in the second panel was performed using T cells cultured in the presence of Z-VAD-FMK. Z-VAD-FMK was removed prior to assay. *P < 0.05 compared with culture without MgCl2 and EGTA.
Figure 7
Figure 7
Fas and major histocompatibility complex (MHC) expression are upregulated on prostate cancer cell lines by treatment with mitoxantrone, docetaxel or irradiation. (a) Basal levels of Fas expression on RM-1, TRAMP-C1, LNCaP and PC-3 cells are shown, as measured by flow cytometry. Filled histograms = anti-Fas antibody-labeled cells, outline histograms = unstained cells, dashed histograms = isotype control-labeled cells. (b) The MFI of anti-Fas antibody staining is increased several-fold above basal levels when RM-1 cells are treated with 1–1000 nm mitoxantrone (n = 2 to 4 for each data point); 1–100 nm docetaxel (n = 3); or 2–8 Gy irradiation (n = 2) for 24 h. Increases in Fas expression are also seen when (c) TRAMP-C1 and (d) LNCaP cells are exposed to 100 nm mitoxantrone (n = 3 or 4), 100 nm docetaxel (n = 3), or 8 Gy irradiation (n = 2). (e) MFI of anti-H-2 Kb and H-2 Db antibody-labeled RM-1 cells 24, 48 and 72 h after exposure to 1, 10, or 100 nm mitoxantrone or docetaxel was measured by flow cytometry. n = 3 for each data point except cells treated for 72 h with 100 nm docetaxel or mitoxantrone, where cells from three replicate wells were pooled and analyzed together. *P < 0.05. M = mitoxantrone, D = docetaxel. Results are presented as fold-change in MFI compared with untreated control cells.

Similar articles

Cited by

References

    1. Morgan RA, Dudley ME, Wunderlich JR, Hughes MS, Yang JC, Sherry RM, et al. Cancer regression in patients after transfer of genetically engineered lymphocytes. Science. 2006;314:126–129. - PMC - PubMed
    1. Rosenberg SA, Dudley ME. Cancer regression in patients with metastatic melanoma after the transfer of autologous antitumor lymphocytes. Proc Natl Acad Sci USA. 2004;101:14639–14645. - PMC - PubMed
    1. Gade TPF, Hassen W, Santos E, Gunset G, Saudemont A, Gong MC, et al. Targeted elimination of prostate cancer by genetically directed human T lymphocytes. Cancer Res. 2005;65:9080–9088. - PubMed
    1. Kershaw MH, Teng MW, Smyth MJ, Darcy PK. Supernatural T cells: genetic modification of T cells for cancer therapy. Nat Rev Immunol. 2005;5:928–940. - PubMed
    1. Lu B, Finn OJ. T-cell death and cancer immune tolerance. Cell Death Differ. 2008;15:70–79. - PubMed

Publication types

MeSH terms