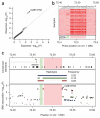
Six new loci associated with body mass index highlight a neuronal influence on body weight regulation
- PMID: 19079261
- PMCID: PMC2695662
- DOI: 10.1038/ng.287
Six new loci associated with body mass index highlight a neuronal influence on body weight regulation
Abstract
Common variants at only two loci, FTO and MC4R, have been reproducibly associated with body mass index (BMI) in humans. To identify additional loci, we conducted meta-analysis of 15 genome-wide association studies for BMI (n > 32,000) and followed up top signals in 14 additional cohorts (n > 59,000). We strongly confirm FTO and MC4R and identify six additional loci (P < 5 x 10(-8)): TMEM18, KCTD15, GNPDA2, SH2B1, MTCH2 and NEGR1 (where a 45-kb deletion polymorphism is a candidate causal variant). Several of the likely causal genes are highly expressed or known to act in the central nervous system (CNS), emphasizing, as in rare monogenic forms of obesity, the role of the CNS in predisposition to obesity.
Figures


Similar articles
-
Genome-wide association yields new sequence variants at seven loci that associate with measures of obesity.Nat Genet. 2009 Jan;41(1):18-24. doi: 10.1038/ng.274. Epub 2008 Dec 14. Nat Genet. 2009. PMID: 19079260
-
Study of eight GWAS-identified common variants for association with obesity-related indices in Chinese children at puberty.Int J Obes (Lond). 2012 Apr;36(4):542-7. doi: 10.1038/ijo.2011.218. Epub 2011 Nov 15. Int J Obes (Lond). 2012. PMID: 22083549
-
Obesity-susceptibility loci have a limited influence on birth weight: a meta-analysis of up to 28,219 individuals.Am J Clin Nutr. 2011 Apr;93(4):851-60. doi: 10.3945/ajcn.110.000828. Epub 2011 Jan 19. Am J Clin Nutr. 2011. PMID: 21248185
-
Genetic determinants of obesity and related vascular diseases.Vitam Horm. 2013;91:29-48. doi: 10.1016/B978-0-12-407766-9.00002-X. Vitam Horm. 2013. PMID: 23374711 Review.
-
What model organisms and interactomics can reveal about the genetics of human obesity.Cell Mol Life Sci. 2012 Nov;69(22):3819-34. doi: 10.1007/s00018-012-1022-5. Epub 2012 May 23. Cell Mol Life Sci. 2012. PMID: 22618246 Free PMC article. Review.
Cited by
-
A survival Kit for pancreatic beta cells: stem cell factor and c-Kit receptor tyrosine kinase.Diabetologia. 2015 Apr;58(4):654-65. doi: 10.1007/s00125-015-3504-0. Epub 2015 Feb 3. Diabetologia. 2015. PMID: 25643653 Review.
-
Amerindians show no association of PPAR-γ2 gene Ala12 allele and obesity: an "unthrifty" variant population genetics.Mol Biol Rep. 2013 Feb;40(2):1767-74. doi: 10.1007/s11033-012-2230-7. Epub 2012 Oct 25. Mol Biol Rep. 2013. PMID: 23096090
-
Role of interactions in pharmacogenetic studies: leukotrienes in asthma.Pharmacogenomics. 2013 Jun;14(8):923-9. doi: 10.2217/pgs.13.70. Pharmacogenomics. 2013. PMID: 23746186 Free PMC article.
-
Linear regression in genetic association studies.PLoS One. 2013;8(2):e56976. doi: 10.1371/journal.pone.0056976. Epub 2013 Feb 21. PLoS One. 2013. PMID: 23437286 Free PMC article.
-
A nexus of lipid and O-Glcnac metabolism in physiology and disease.Front Endocrinol (Lausanne). 2022 Aug 30;13:943576. doi: 10.3389/fendo.2022.943576. eCollection 2022. Front Endocrinol (Lausanne). 2022. PMID: 36111295 Free PMC article. Review.
References
-
- Flegal KM, Graubard BI, Williamson DF, Gail MH. Cause-specific excess deaths associated with underweight, overweight, and obesity. J. Am. Med. Assoc. 2007;298:2028–2037. - PubMed
-
- Finkelstein EA, et al. The lifetime medical cost burden of overweight and obesity: implications for obesity prevention. Obesity (Silver Spring) 2008;16:1843–1848. - PubMed
-
- Maes HH, Neale MC, Eaves LJ. Genetic and environmental factors in relative body weight and human adiposity. Behav. Genet. 1997;27:325–351. - PubMed
-
- Farooqi IS. Genetic aspects of severe childhood obesity. Pediatr. Endocrinol. Rev. 2006;3(Suppl. 4):528–536. - PubMed
Publication types
MeSH terms
Grants and funding
- G0800582/MRC_/Medical Research Council/United Kingdom
- 076467/Z/05/Z/WT_/Wellcome Trust/United Kingdom
- G9815508/MRC_/Medical Research Council/United Kingdom
- 089061/WT_/Wellcome Trust/United Kingdom
- U01 CA049449/CA/NCI NIH HHS/United States
- R01 CA050385/CA/NCI NIH HHS/United States
- 01-HG-65403/HG/NHGRI NIH HHS/United States
- 5UO1CA098233/CA/NCI NIH HHS/United States
- K23 DK080145/DK/NIDDK NIH HHS/United States
- DK075787/DK/NIDDK NIH HHS/United States
- 082390/WT_/Wellcome Trust/United Kingdom
- T32DK07191/DK/NIDDK NIH HHS/United States
- R56 DK062370/DK/NIDDK NIH HHS/United States
- N01HG65403/HG/NHGRI NIH HHS/United States
- 079557/WT_/Wellcome Trust/United Kingdom
- U01 HL084729/HL/NHLBI NIH HHS/United States
- P01 CA087969/CA/NCI NIH HHS/United States
- T32 DK007191/DK/NIDDK NIH HHS/United States
- R01 HL087679/HL/NHLBI NIH HHS/United States
- R01 CA067262/CA/NCI NIH HHS/United States
- N01-AG-1-2109/AG/NIA NIH HHS/United States
- R01 HG002651/HG/NHGRI NIH HHS/United States
- HL087679/HL/NHLBI NIH HHS/United States
- 068545/Z/02/WT_/Wellcome Trust/United Kingdom
- K23 DK080145-01/DK/NIDDK NIH HHS/United States
- 1Z01 HG000024/HG/NHGRI NIH HHS/United States
- G0400491/MRC_/Medical Research Council/United Kingdom
- MC_U147585819/MRC_/Medical Research Council/United Kingdom
- R01 DK072193/DK/NIDDK NIH HHS/United States
- CA87969/CA/NCI NIH HHS/United States
- FS/05/061/19501/BHF_/British Heart Foundation/United Kingdom
- F32 DK079466/DK/NIDDK NIH HHS/United States
- 077011/WT_/Wellcome Trust/United Kingdom
- R01 DK075787/DK/NIDDK NIH HHS/United States
- CA49449/CA/NCI NIH HHS/United States
- U.1475.00.003.00010.02 (85819)/MRC_/Medical Research Council/United Kingdom
- U01 CA067262/CA/NCI NIH HHS/United States
- R01 CA065725/CA/NCI NIH HHS/United States
- 077016/WT_/Wellcome Trust/United Kingdom
- CA67262/CA/NCI NIH HHS/United States
- R01 DK062370/DK/NIDDK NIH HHS/United States
- 1RL1MH083268/MH/NIMH NIH HHS/United States
- K23 DK067288/DK/NIDDK NIH HHS/United States
- MC_UP_A620_1014/MRC_/Medical Research Council/United Kingdom
- DK072193/DK/NIDDK NIH HHS/United States
- F32 DK079466-01/DK/NIDDK NIH HHS/United States
- HL084729/HL/NHLBI NIH HHS/United States
- 076113/WT_/Wellcome Trust/United Kingdom
- R01 DK029867/DK/NIDDK NIH HHS/United States
- G0600705/MRC_/Medical Research Council/United Kingdom
- G0401527/MRC_/Medical Research Council/United Kingdom
- MC_U105630924/MRC_/Medical Research Council/United Kingdom
- Z01 HG000024/ImNIH/Intramural NIH HHS/United States
- 090532/WT_/Wellcome Trust/United Kingdom
- G0000649/MRC_/Medical Research Council/United Kingdom
- MC_U106179472/MRC_/Medical Research Council/United Kingdom
- G9521010/MRC_/Medical Research Council/United Kingdom
- G9824984/MRC_/Medical Research Council/United Kingdom
- G0701863/MRC_/Medical Research Council/United Kingdom
- U01 CA098233/CA/NCI NIH HHS/United States
- G0400874/MRC_/Medical Research Council/United Kingdom
- U01 DK062370/DK/NIDDK NIH HHS/United States
- HG02651/HG/NHGRI NIH HHS/United States
- DK062370/DK/NIDDK NIH HHS/United States
- G0000934/MRC_/Medical Research Council/United Kingdom
- MC_U147585827/MRC_/Medical Research Council/United Kingdom
- R01 CA049449/CA/NCI NIH HHS/United States
- CA50385/CA/NCI NIH HHS/United States
- RL1 MH083268/MH/NIMH NIH HHS/United States
- MC_U106179471/MRC_/Medical Research Council/United Kingdom
- MC_U106188470/MRC_/Medical Research Council/United Kingdom
- MC_U147585824/MRC_/Medical Research Council/United Kingdom
- G0601261/MRC_/Medical Research Council/United Kingdom
- CA65725/CA/NCI NIH HHS/United States
LinkOut - more resources
Full Text Sources
Other Literature Sources
Medical
Molecular Biology Databases

