

Expression and distribution of Toll-like receptors 11-13 in the brain during murine neurocysticercosis
- PMID: 19077284
- PMCID: PMC2631477
- DOI: 10.1186/1742-2094-5-53
Expression and distribution of Toll-like receptors 11-13 in the brain during murine neurocysticercosis
Abstract
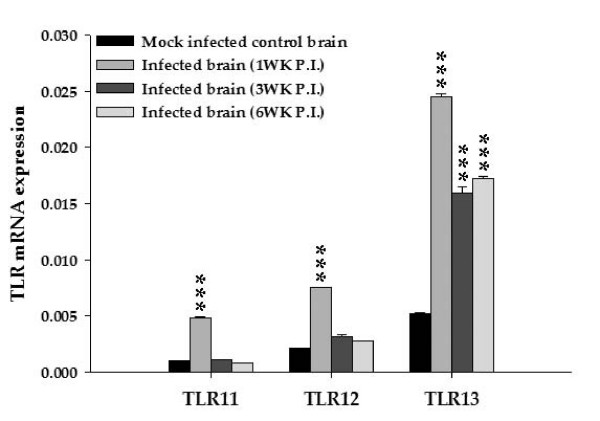
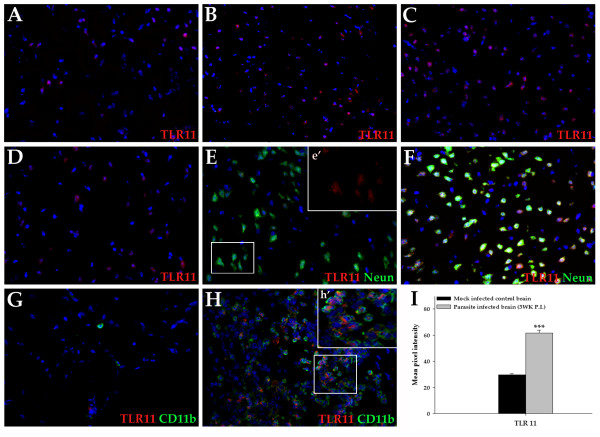
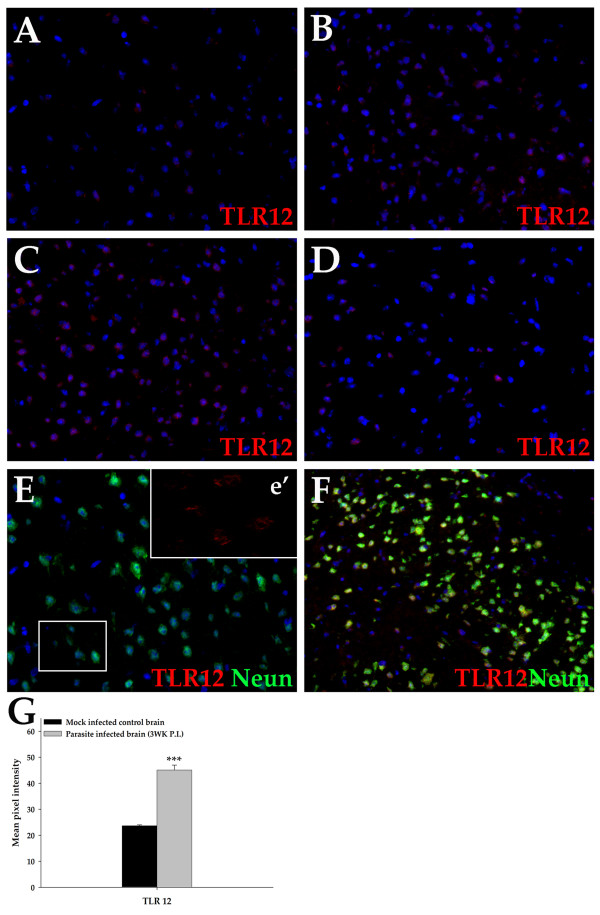
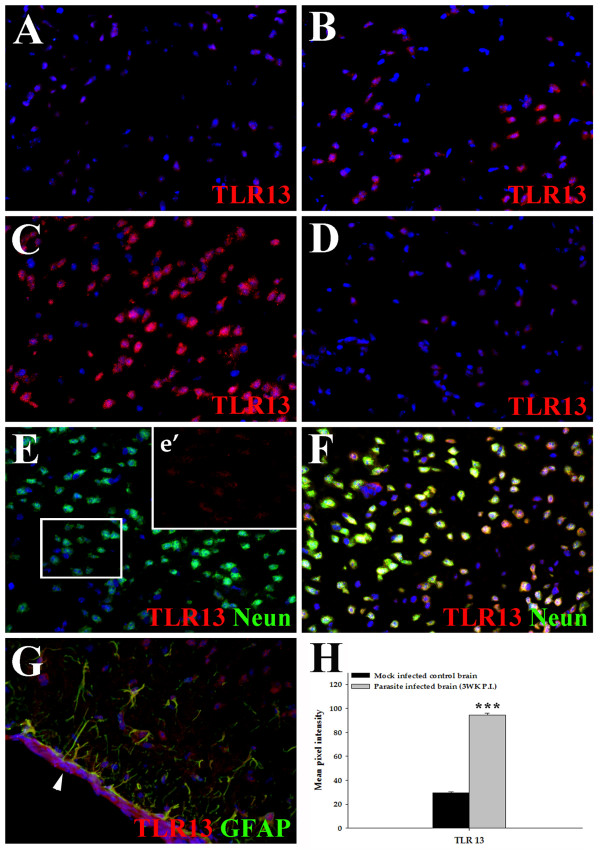
The functions of Toll-like receptors (TLRs) 11-13 in central nervous system (CNS) infections are currently unknown. Using a murine model of neurocysticercosis, we investigated the expression and distribution of TLRs 11-13 by using both gene specific real-time PCR analysis and in situ immunofluorescence microscopy in both control and neurocysticercosis brains. In the mock infected brain, mRNAs of TLRs 11-13 were constitutively expressed. Parasite infection caused an increase of both mRNAs and protein levels of all three TLRs by several fold. All three TLR proteins were present in both CNS and immune cell types. Among them TLR13 was expressed the most in terms of number of positive cells and brain areas expressing it, followed by TLR11 and TLR12 respectively. Among the nervous tissue cells, TLRs 11-13 protein levels appeared highest in neurons. However, TLR13 expression was also present in ependymal cells, endothelial cells of pial blood vessels, and astrocytes. In contrast, infiltrating CD11b and CD11c positive myeloid cells predominantly produced TLR11 protein, particularly early during infection at 1 wk post infection (approximately 50% cells). TLRs 12 and 13 proteins were present on approximately 5% of infiltrating immune cells. The infiltrating cells positive for TLRs 11-13 were mostly of myeloid origin, CD11b+ cells. This report provides a comprehensive analysis of the expression of TLRs 11-13 in normal and parasite infected mouse brains and suggests a role for them in CNS infections.
Figures
Similar articles
-
Expression and distribution of Toll-like receptors in the brain during murine neurocysticercosis.J Neuroimmunol. 2006 Dec;181(1-2):46-56. doi: 10.1016/j.jneuroim.2006.07.019. Epub 2006 Sep 29. J Neuroimmunol. 2006. PMID: 17011049 Free PMC article.
-
Increased disease severity of parasite-infected TLR2-/- mice is correlated with decreased central nervous system inflammation and reduced numbers of cells with alternatively activated macrophage phenotypes in a murine model of neurocysticercosis.Infect Immun. 2011 Jul;79(7):2586-96. doi: 10.1128/IAI.00920-10. Epub 2011 Apr 11. Infect Immun. 2011. PMID: 21482681 Free PMC article.
-
Evidence for differential changes of junctional complex proteins in murine neurocysticercosis dependent upon CNS vasculature.Brain Res. 2007 Sep 12;1169:98-111. doi: 10.1016/j.brainres.2007.07.010. Epub 2007 Jul 14. Brain Res. 2007. PMID: 17686468 Free PMC article.
-
Toll-like receptors in health and disease in the brain: mechanisms and therapeutic potential.Clin Sci (Lond). 2011 Nov;121(9):367-87. doi: 10.1042/CS20110164. Clin Sci (Lond). 2011. PMID: 21745188 Free PMC article. Review.
-
Role of astroglial toll-like receptors (TLRs) in central nervous system infections, injury and neurodegenerative diseases.Brain Behav Immun. 2021 Jan;91:740-755. doi: 10.1016/j.bbi.2020.10.007. Epub 2020 Oct 8. Brain Behav Immun. 2021. PMID: 33039660 Free PMC article. Review.
Cited by
-
Identification of HSF1 Target Genes Involved in Thermal Stress in the Pacific Oyster Crassostrea gigas by ChIP-seq.Mar Biotechnol (NY). 2020 Apr;22(2):167-179. doi: 10.1007/s10126-019-09942-6. Epub 2020 Jan 21. Mar Biotechnol (NY). 2020. PMID: 31965439
-
Cannabinoid modulation of neuroinflammatory disorders.Curr Neuropharmacol. 2012 Jun;10(2):159-66. doi: 10.2174/157015912800604515. Curr Neuropharmacol. 2012. PMID: 23204985 Free PMC article.
-
Ependymal cells: roles in central nervous system infections and therapeutic application.J Neuroinflammation. 2024 Oct 9;21(1):255. doi: 10.1186/s12974-024-03240-2. J Neuroinflammation. 2024. PMID: 39385253 Free PMC article. Review.
-
Type-1 interferons contribute to oxygen glucose deprivation induced neuro-inflammation in BE(2)M17 human neuroblastoma cells.J Neuroinflammation. 2014 Mar 6;11:43. doi: 10.1186/1742-2094-11-43. J Neuroinflammation. 2014. PMID: 24602263 Free PMC article.
-
Pivotal role of TLR4 receptors in alcohol-induced neuroinflammation and brain damage.J Neurosci. 2010 Jun 16;30(24):8285-95. doi: 10.1523/JNEUROSCI.0976-10.2010. J Neurosci. 2010. PMID: 20554880 Free PMC article.
References
-
- Roman G, Sotelo J, Del Brutto O, Flisser A, Dumas M, Wadia N, Botero D, Cruz M, Garcia H, de Bittencourt PR, Trelles L, Arriagada C, Lorenzana P, Nash TE, Spina-França A. A proposal to declare neurocysticercosis an international reportable disease. Bull World Health Organ. 2000;78:399–406. - PMC - PubMed
-
- Ostrosky-Zeichner L, Garcia-Mendoza E, Rios C, Sotelo J. Humoral and cellular immune response within the subarachnoid space of patients with neurocysticercosis. Arch Med Res. 1996;27:513–517. - PubMed
Publication types
MeSH terms
Substances
Grants and funding
LinkOut - more resources
Full Text Sources
Medical
Molecular Biology Databases
Research Materials
